Barbadian vs Bhutanese Male Unemployment
COMPARE
Barbadian
Bhutanese
Male Unemployment
Male Unemployment Comparison
Barbadians
Bhutanese
6.9%
MALE UNEMPLOYMENT
0.0/ 100
METRIC RATING
309th/ 347
METRIC RANK
4.9%
MALE UNEMPLOYMENT
98.9/ 100
METRIC RATING
46th/ 347
METRIC RANK
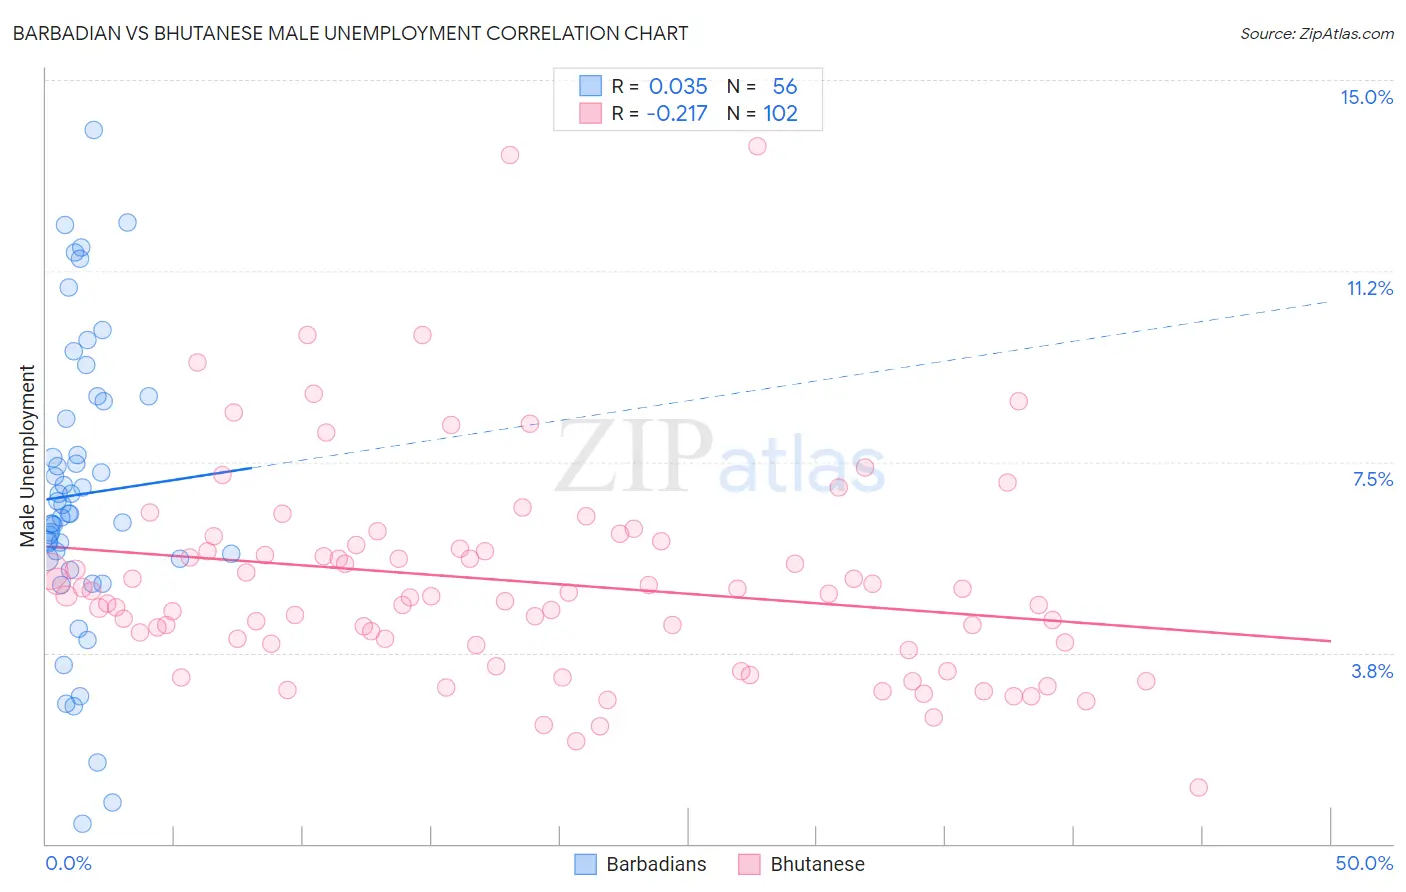
Barbadian vs Bhutanese Male Unemployment Correlation Chart
The statistical analysis conducted on geographies consisting of 141,188,365 people shows no correlation between the proportion of Barbadians and unemployment rate among males in the United States with a correlation coefficient (R) of 0.035 and weighted average of 6.9%. Similarly, the statistical analysis conducted on geographies consisting of 452,760,879 people shows a weak negative correlation between the proportion of Bhutanese and unemployment rate among males in the United States with a correlation coefficient (R) of -0.217 and weighted average of 4.9%, a difference of 38.6%.
Male Unemployment Correlation Summary
| Measurement | Barbadian | Bhutanese |
| Minimum | 0.40% | 1.1% |
| Maximum | 14.0% | 13.7% |
| Range | 13.6% | 12.6% |
| Mean | 6.9% | 5.2% |
| Median | 6.5% | 4.9% |
| Interquartile 25% (IQ1) | 5.6% | 3.9% |
| Interquartile 75% (IQ3) | 8.5% | 5.8% |
| Interquartile Range (IQR) | 2.9% | 1.9% |
| Standard Deviation (Sample) | 2.8% | 2.1% |
| Standard Deviation (Population) | 2.8% | 2.1% |
Similar Demographics by Male Unemployment
Demographics Similar to Barbadians by Male Unemployment
In terms of male unemployment, the demographic groups most similar to Barbadians are Aleut (6.8%, a difference of 0.41%), Black/African American (6.9%, a difference of 0.64%), Immigrants from Armenia (6.9%, a difference of 0.96%), Lumbee (6.9%, a difference of 1.2%), and Immigrants from Dominica (7.0%, a difference of 2.2%).
| Demographics | Rating | Rank | Male Unemployment |
| Ute | 0.0 /100 | #302 | Tragic 6.6% |
| Immigrants | West Indies | 0.0 /100 | #303 | Tragic 6.7% |
| West Indians | 0.0 /100 | #304 | Tragic 6.7% |
| Trinidadians and Tobagonians | 0.0 /100 | #305 | Tragic 6.7% |
| Immigrants | Trinidad and Tobago | 0.0 /100 | #306 | Tragic 6.7% |
| Immigrants | Jamaica | 0.0 /100 | #307 | Tragic 6.7% |
| Aleuts | 0.0 /100 | #308 | Tragic 6.8% |
| Barbadians | 0.0 /100 | #309 | Tragic 6.9% |
| Blacks/African Americans | 0.0 /100 | #310 | Tragic 6.9% |
| Immigrants | Armenia | 0.0 /100 | #311 | Tragic 6.9% |
| Lumbee | 0.0 /100 | #312 | Tragic 6.9% |
| Immigrants | Dominica | 0.0 /100 | #313 | Tragic 7.0% |
| Immigrants | Barbados | 0.0 /100 | #314 | Tragic 7.1% |
| Houma | 0.0 /100 | #315 | Tragic 7.1% |
| Immigrants | Guyana | 0.0 /100 | #316 | Tragic 7.1% |
Demographics Similar to Bhutanese by Male Unemployment
In terms of male unemployment, the demographic groups most similar to Bhutanese are Austrian (4.9%, a difference of 0.070%), Immigrants from Zimbabwe (4.9%, a difference of 0.090%), Immigrants from Scotland (4.9%, a difference of 0.090%), Polish (4.9%, a difference of 0.10%), and Croatian (4.9%, a difference of 0.11%).
| Demographics | Rating | Rank | Male Unemployment |
| Burmese | 99.3 /100 | #39 | Exceptional 4.9% |
| Northern Europeans | 99.3 /100 | #40 | Exceptional 4.9% |
| Chinese | 99.3 /100 | #41 | Exceptional 4.9% |
| Immigrants | Belgium | 99.2 /100 | #42 | Exceptional 4.9% |
| Immigrants | Japan | 99.2 /100 | #43 | Exceptional 4.9% |
| Immigrants | Korea | 99.1 /100 | #44 | Exceptional 4.9% |
| Immigrants | Zimbabwe | 99.0 /100 | #45 | Exceptional 4.9% |
| Bhutanese | 98.9 /100 | #46 | Exceptional 4.9% |
| Austrians | 98.9 /100 | #47 | Exceptional 4.9% |
| Immigrants | Scotland | 98.9 /100 | #48 | Exceptional 4.9% |
| Poles | 98.9 /100 | #49 | Exceptional 4.9% |
| Croatians | 98.9 /100 | #50 | Exceptional 4.9% |
| Slovenes | 98.8 /100 | #51 | Exceptional 5.0% |
| Irish | 98.8 /100 | #52 | Exceptional 5.0% |
| Jordanians | 98.8 /100 | #53 | Exceptional 5.0% |