Immigrants from Croatia vs Immigrants from Egypt Unemployment
COMPARE
Immigrants from Croatia
Immigrants from Egypt
Unemployment
Unemployment Comparison
Immigrants from Croatia
Immigrants from Egypt
5.1%
UNEMPLOYMENT
86.8/ 100
METRIC RATING
131st/ 347
METRIC RANK
5.2%
UNEMPLOYMENT
66.7/ 100
METRIC RATING
158th/ 347
METRIC RANK
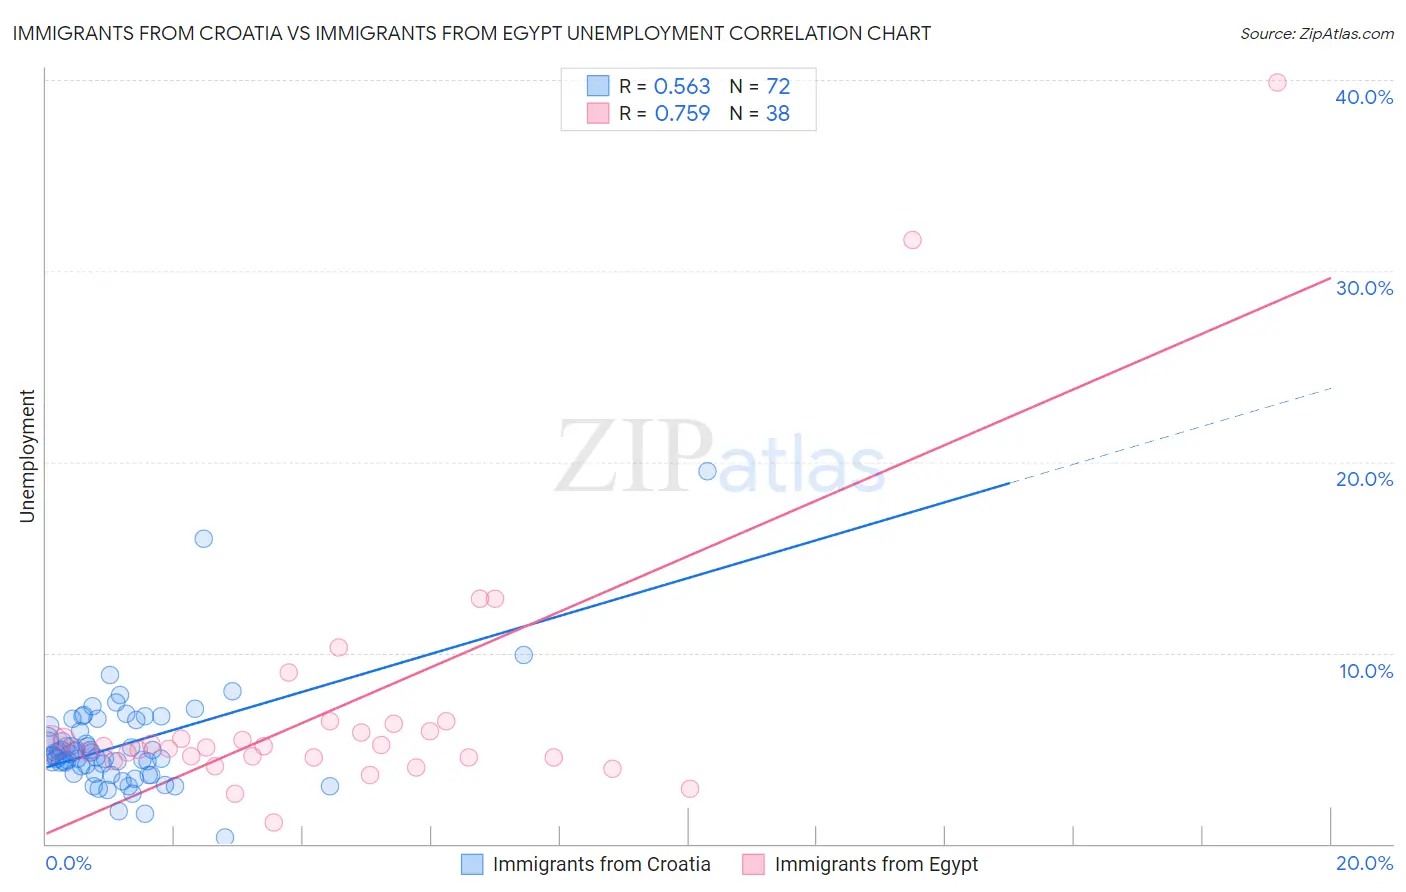
Immigrants from Croatia vs Immigrants from Egypt Unemployment Correlation Chart
The statistical analysis conducted on geographies consisting of 132,546,929 people shows a substantial positive correlation between the proportion of Immigrants from Croatia and unemployment in the United States with a correlation coefficient (R) of 0.563 and weighted average of 5.1%. Similarly, the statistical analysis conducted on geographies consisting of 245,443,113 people shows a strong positive correlation between the proportion of Immigrants from Egypt and unemployment in the United States with a correlation coefficient (R) of 0.759 and weighted average of 5.2%, a difference of 1.9%.
Unemployment Correlation Summary
| Measurement | Immigrants from Croatia | Immigrants from Egypt |
| Minimum | 0.30% | 1.1% |
| Maximum | 19.5% | 39.9% |
| Range | 19.2% | 38.8% |
| Mean | 5.2% | 7.1% |
| Median | 4.7% | 5.0% |
| Interquartile 25% (IQ1) | 3.9% | 4.5% |
| Interquartile 75% (IQ3) | 6.0% | 5.9% |
| Interquartile Range (IQR) | 2.2% | 1.4% |
| Standard Deviation (Sample) | 2.7% | 7.3% |
| Standard Deviation (Population) | 2.7% | 7.2% |
Similar Demographics by Unemployment
Demographics Similar to Immigrants from Croatia by Unemployment
In terms of unemployment, the demographic groups most similar to Immigrants from Croatia are Immigrants from Ethiopia (5.1%, a difference of 0.010%), Immigrants from Jordan (5.1%, a difference of 0.020%), Iranian (5.1%, a difference of 0.030%), Immigrants from Europe (5.1%, a difference of 0.060%), and Immigrants from Burma/Myanmar (5.1%, a difference of 0.070%).
| Demographics | Rating | Rank | Unemployment |
| Ethiopians | 88.6 /100 | #124 | Excellent 5.1% |
| Immigrants | Eastern Asia | 88.3 /100 | #125 | Excellent 5.1% |
| Kenyans | 88.2 /100 | #126 | Excellent 5.1% |
| Immigrants | Kenya | 88.2 /100 | #127 | Excellent 5.1% |
| Immigrants | Eastern Africa | 88.1 /100 | #128 | Excellent 5.1% |
| Immigrants | Latvia | 88.0 /100 | #129 | Excellent 5.1% |
| Iranians | 86.9 /100 | #130 | Excellent 5.1% |
| Immigrants | Croatia | 86.8 /100 | #131 | Excellent 5.1% |
| Immigrants | Ethiopia | 86.7 /100 | #132 | Excellent 5.1% |
| Immigrants | Jordan | 86.6 /100 | #133 | Excellent 5.1% |
| Immigrants | Europe | 86.3 /100 | #134 | Excellent 5.1% |
| Immigrants | Burma/Myanmar | 86.2 /100 | #135 | Excellent 5.1% |
| Immigrants | Spain | 86.2 /100 | #136 | Excellent 5.1% |
| Immigrants | Saudi Arabia | 85.6 /100 | #137 | Excellent 5.1% |
| Immigrants | Hungary | 85.6 /100 | #138 | Excellent 5.1% |
Demographics Similar to Immigrants from Egypt by Unemployment
In terms of unemployment, the demographic groups most similar to Immigrants from Egypt are Immigrants from Russia (5.2%, a difference of 0.0%), Laotian (5.2%, a difference of 0.020%), Immigrants from Oceania (5.2%, a difference of 0.10%), Spanish (5.2%, a difference of 0.11%), and Immigrants from Zaire (5.2%, a difference of 0.13%).
| Demographics | Rating | Rank | Unemployment |
| Immigrants | Eastern Europe | 75.3 /100 | #151 | Good 5.2% |
| Immigrants | Hong Kong | 75.2 /100 | #152 | Good 5.2% |
| Egyptians | 75.2 /100 | #153 | Good 5.2% |
| Immigrants | China | 74.7 /100 | #154 | Good 5.2% |
| Immigrants | Northern Africa | 71.3 /100 | #155 | Good 5.2% |
| Immigrants | Kazakhstan | 70.4 /100 | #156 | Good 5.2% |
| Sri Lankans | 69.5 /100 | #157 | Good 5.2% |
| Immigrants | Egypt | 66.7 /100 | #158 | Good 5.2% |
| Immigrants | Russia | 66.6 /100 | #159 | Good 5.2% |
| Laotians | 66.3 /100 | #160 | Good 5.2% |
| Immigrants | Oceania | 65.2 /100 | #161 | Good 5.2% |
| Spanish | 65.1 /100 | #162 | Good 5.2% |
| Immigrants | Zaire | 64.7 /100 | #163 | Good 5.2% |
| Immigrants | Colombia | 64.7 /100 | #164 | Good 5.2% |
| Immigrants | Brazil | 63.1 /100 | #165 | Good 5.2% |