British vs Filipino Unemployment
COMPARE
British
Filipino
Unemployment
Unemployment Comparison
British
Filipinos
4.7%
UNEMPLOYMENT
99.9/ 100
METRIC RATING
23rd/ 347
METRIC RANK
4.8%
UNEMPLOYMENT
99.5/ 100
METRIC RATING
42nd/ 347
METRIC RANK
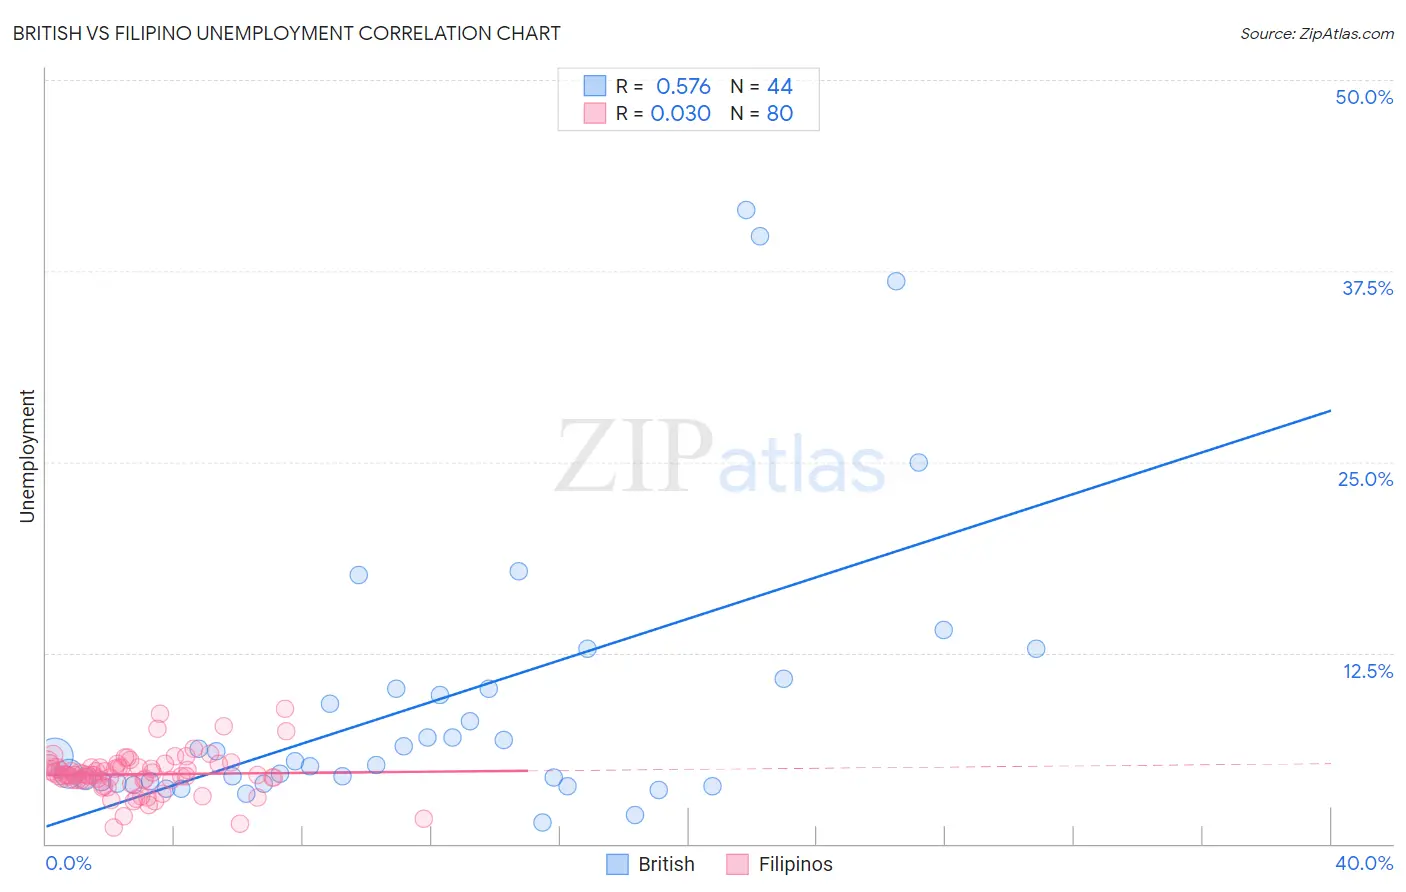
British vs Filipino Unemployment Correlation Chart
The statistical analysis conducted on geographies consisting of 529,433,741 people shows a substantial positive correlation between the proportion of British and unemployment in the United States with a correlation coefficient (R) of 0.576 and weighted average of 4.7%. Similarly, the statistical analysis conducted on geographies consisting of 254,275,542 people shows no correlation between the proportion of Filipinos and unemployment in the United States with a correlation coefficient (R) of 0.030 and weighted average of 4.8%, a difference of 2.5%.
Unemployment Correlation Summary
| Measurement | British | Filipino |
| Minimum | 1.4% | 1.1% |
| Maximum | 41.5% | 8.8% |
| Range | 40.1% | 7.7% |
| Mean | 9.3% | 4.5% |
| Median | 5.6% | 4.5% |
| Interquartile 25% (IQ1) | 4.0% | 4.2% |
| Interquartile 75% (IQ3) | 10.1% | 5.0% |
| Interquartile Range (IQR) | 6.1% | 0.84% |
| Standard Deviation (Sample) | 9.5% | 1.4% |
| Standard Deviation (Population) | 9.4% | 1.4% |
Demographics Similar to British and Filipinos by Unemployment
In terms of unemployment, the demographic groups most similar to British are Venezuelan (4.7%, a difference of 0.080%), Latvian (4.7%, a difference of 0.15%), Bulgarian (4.7%, a difference of 0.19%), Thai (4.7%, a difference of 0.30%), and Finnish (4.7%, a difference of 0.40%). Similarly, the demographic groups most similar to Filipinos are Immigrants from Bosnia and Herzegovina (4.8%, a difference of 0.48%), Northern European (4.8%, a difference of 0.50%), Lithuanian (4.8%, a difference of 0.52%), Bolivian (4.8%, a difference of 0.67%), and Czechoslovakian (4.8%, a difference of 0.86%).
| Demographics | Rating | Rank | Unemployment |
| Thais | 99.9 /100 | #22 | Exceptional 4.7% |
| British | 99.9 /100 | #23 | Exceptional 4.7% |
| Venezuelans | 99.9 /100 | #24 | Exceptional 4.7% |
| Latvians | 99.9 /100 | #25 | Exceptional 4.7% |
| Bulgarians | 99.9 /100 | #26 | Exceptional 4.7% |
| Finns | 99.9 /100 | #27 | Exceptional 4.7% |
| Cubans | 99.8 /100 | #28 | Exceptional 4.7% |
| Poles | 99.8 /100 | #29 | Exceptional 4.7% |
| Irish | 99.8 /100 | #30 | Exceptional 4.8% |
| Croatians | 99.8 /100 | #31 | Exceptional 4.8% |
| Zimbabweans | 99.8 /100 | #32 | Exceptional 4.8% |
| Sudanese | 99.8 /100 | #33 | Exceptional 4.8% |
| Immigrants | Bolivia | 99.8 /100 | #34 | Exceptional 4.8% |
| Scotch-Irish | 99.8 /100 | #35 | Exceptional 4.8% |
| Tongans | 99.7 /100 | #36 | Exceptional 4.8% |
| Czechoslovakians | 99.7 /100 | #37 | Exceptional 4.8% |
| Bolivians | 99.7 /100 | #38 | Exceptional 4.8% |
| Lithuanians | 99.7 /100 | #39 | Exceptional 4.8% |
| Northern Europeans | 99.7 /100 | #40 | Exceptional 4.8% |
| Immigrants | Bosnia and Herzegovina | 99.7 /100 | #41 | Exceptional 4.8% |
| Filipinos | 99.5 /100 | #42 | Exceptional 4.8% |