Immigrants from Nepal vs Immigrants from Eastern Europe Unemployment Among Women with Children Ages 6 to 17 years
COMPARE
Immigrants from Nepal
Immigrants from Eastern Europe
Unemployment Among Women with Children Ages 6 to 17 years
Unemployment Among Women with Children Ages 6 to 17 years Comparison
Immigrants from Nepal
Immigrants from Eastern Europe
8.3%
UNEMPLOYMENT AMONG WOMEN WITH CHILDREN AGES 6 TO 17 YEARS
99.8/ 100
METRIC RATING
72nd/ 347
METRIC RANK
8.5%
UNEMPLOYMENT AMONG WOMEN WITH CHILDREN AGES 6 TO 17 YEARS
99.0/ 100
METRIC RATING
91st/ 347
METRIC RANK
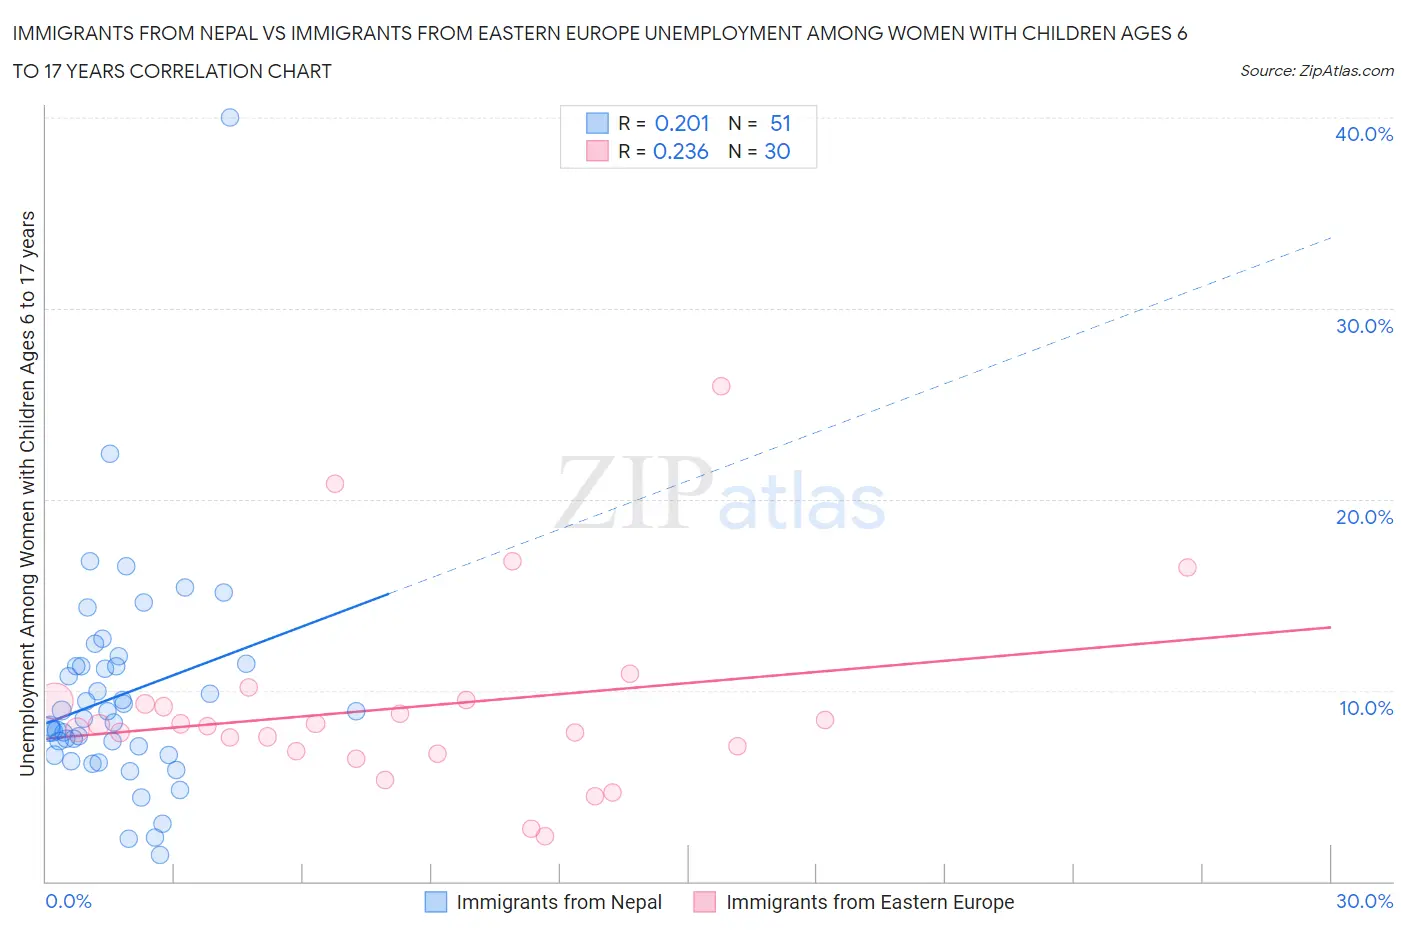
Immigrants from Nepal vs Immigrants from Eastern Europe Unemployment Among Women with Children Ages 6 to 17 years Correlation Chart
The statistical analysis conducted on geographies consisting of 151,183,417 people shows a weak positive correlation between the proportion of Immigrants from Nepal and unemployment rate among women with children between the ages 6 and 17 in the United States with a correlation coefficient (R) of 0.201 and weighted average of 8.3%. Similarly, the statistical analysis conducted on geographies consisting of 322,191,586 people shows a weak positive correlation between the proportion of Immigrants from Eastern Europe and unemployment rate among women with children between the ages 6 and 17 in the United States with a correlation coefficient (R) of 0.236 and weighted average of 8.5%, a difference of 2.2%.
Unemployment Among Women with Children Ages 6 to 17 years Correlation Summary
| Measurement | Immigrants from Nepal | Immigrants from Eastern Europe |
| Minimum | 1.4% | 2.3% |
| Maximum | 40.0% | 25.9% |
| Range | 38.6% | 23.6% |
| Mean | 9.7% | 9.1% |
| Median | 8.5% | 8.2% |
| Interquartile 25% (IQ1) | 6.6% | 6.8% |
| Interquartile 75% (IQ3) | 11.3% | 9.4% |
| Interquartile Range (IQR) | 4.7% | 2.6% |
| Standard Deviation (Sample) | 5.9% | 5.0% |
| Standard Deviation (Population) | 5.8% | 4.9% |
Demographics Similar to Immigrants from Nepal and Immigrants from Eastern Europe by Unemployment Among Women with Children Ages 6 to 17 years
In terms of unemployment among women with children ages 6 to 17 years, the demographic groups most similar to Immigrants from Nepal are Immigrants from Australia (8.3%, a difference of 0.040%), Spanish American (8.4%, a difference of 0.38%), Samoan (8.4%, a difference of 0.73%), Immigrants from Sri Lanka (8.4%, a difference of 0.81%), and Immigrants from Moldova (8.4%, a difference of 0.84%). Similarly, the demographic groups most similar to Immigrants from Eastern Europe are Yugoslavian (8.5%, a difference of 0.060%), Paiute (8.5%, a difference of 0.10%), Immigrants from Vietnam (8.5%, a difference of 0.18%), Immigrants from Israel (8.5%, a difference of 0.20%), and Alaskan Athabascan (8.5%, a difference of 0.53%).
| Demographics | Rating | Rank | Unemployment Among Women with Children Ages 6 to 17 years |
| Immigrants | Australia | 99.8 /100 | #71 | Exceptional 8.3% |
| Immigrants | Nepal | 99.8 /100 | #72 | Exceptional 8.3% |
| Spanish Americans | 99.8 /100 | #73 | Exceptional 8.4% |
| Samoans | 99.7 /100 | #74 | Exceptional 8.4% |
| Immigrants | Sri Lanka | 99.7 /100 | #75 | Exceptional 8.4% |
| Immigrants | Moldova | 99.7 /100 | #76 | Exceptional 8.4% |
| Iraqis | 99.7 /100 | #77 | Exceptional 8.4% |
| Pakistanis | 99.6 /100 | #78 | Exceptional 8.4% |
| Mongolians | 99.6 /100 | #79 | Exceptional 8.4% |
| Immigrants | Belarus | 99.6 /100 | #80 | Exceptional 8.4% |
| Immigrants | Bolivia | 99.6 /100 | #81 | Exceptional 8.4% |
| Cypriots | 99.6 /100 | #82 | Exceptional 8.4% |
| Bulgarians | 99.5 /100 | #83 | Exceptional 8.4% |
| Japanese | 99.5 /100 | #84 | Exceptional 8.4% |
| Immigrants | North Macedonia | 99.4 /100 | #85 | Exceptional 8.5% |
| Alaskan Athabascans | 99.4 /100 | #86 | Exceptional 8.5% |
| Immigrants | Israel | 99.1 /100 | #87 | Exceptional 8.5% |
| Immigrants | Vietnam | 99.1 /100 | #88 | Exceptional 8.5% |
| Paiute | 99.1 /100 | #89 | Exceptional 8.5% |
| Yugoslavians | 99.0 /100 | #90 | Exceptional 8.5% |
| Immigrants | Eastern Europe | 99.0 /100 | #91 | Exceptional 8.5% |