Welsh vs Immigrants from Eastern Europe Unemployment Among Women with Children Ages 6 to 17 years
COMPARE
Welsh
Immigrants from Eastern Europe
Unemployment Among Women with Children Ages 6 to 17 years
Unemployment Among Women with Children Ages 6 to 17 years Comparison
Welsh
Immigrants from Eastern Europe
9.3%
UNEMPLOYMENT AMONG WOMEN WITH CHILDREN AGES 6 TO 17 YEARS
4.0/ 100
METRIC RATING
230th/ 347
METRIC RANK
8.5%
UNEMPLOYMENT AMONG WOMEN WITH CHILDREN AGES 6 TO 17 YEARS
99.0/ 100
METRIC RATING
91st/ 347
METRIC RANK
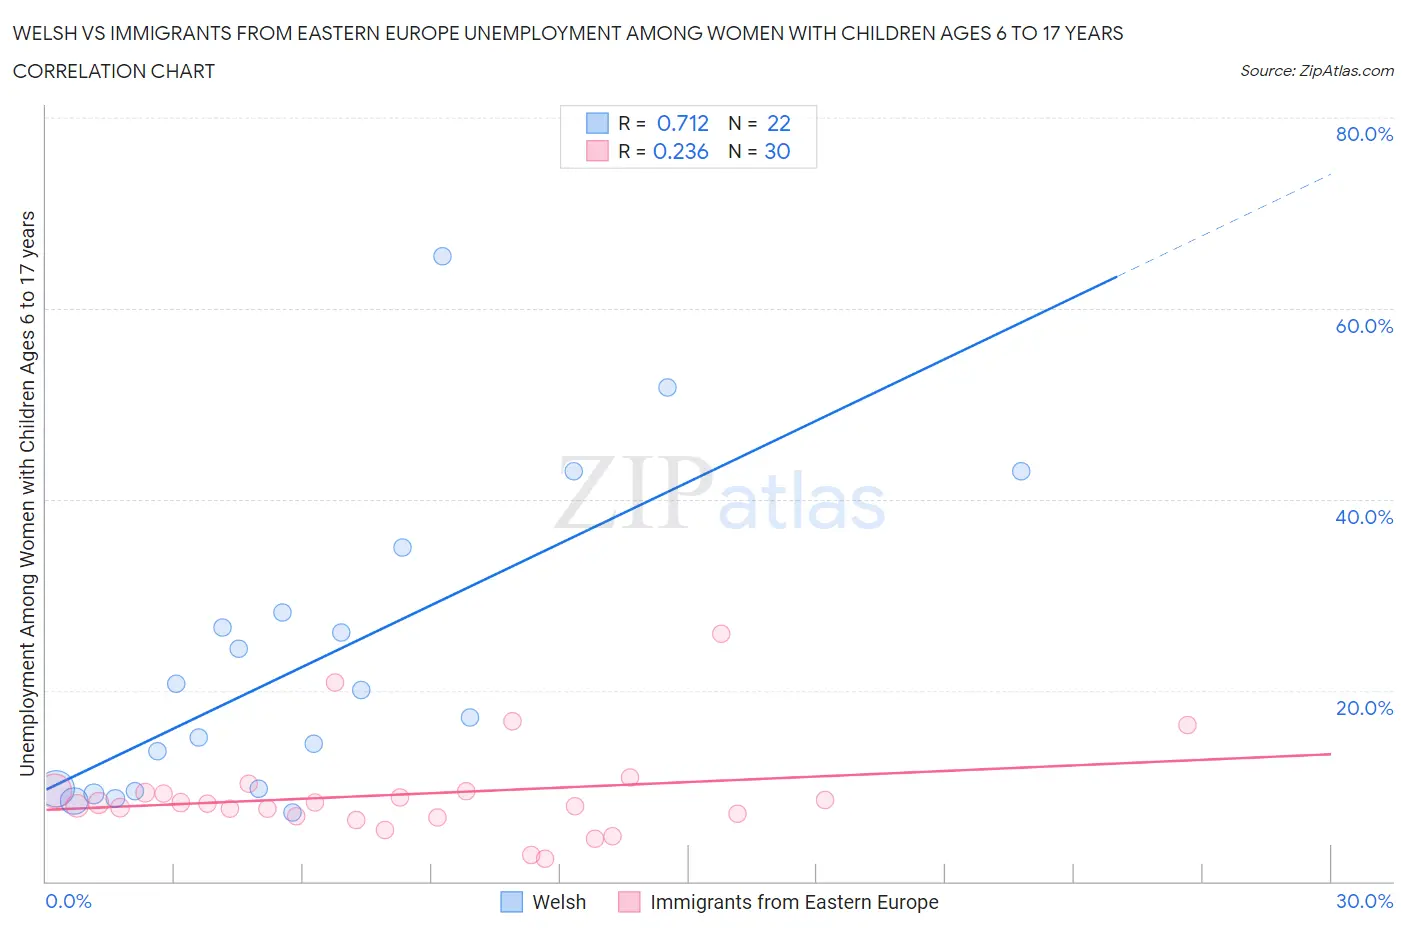
Welsh vs Immigrants from Eastern Europe Unemployment Among Women with Children Ages 6 to 17 years Correlation Chart
The statistical analysis conducted on geographies consisting of 338,386,980 people shows a strong positive correlation between the proportion of Welsh and unemployment rate among women with children between the ages 6 and 17 in the United States with a correlation coefficient (R) of 0.712 and weighted average of 9.3%. Similarly, the statistical analysis conducted on geographies consisting of 322,191,586 people shows a weak positive correlation between the proportion of Immigrants from Eastern Europe and unemployment rate among women with children between the ages 6 and 17 in the United States with a correlation coefficient (R) of 0.236 and weighted average of 8.5%, a difference of 9.1%.
Unemployment Among Women with Children Ages 6 to 17 years Correlation Summary
| Measurement | Welsh | Immigrants from Eastern Europe |
| Minimum | 7.2% | 2.3% |
| Maximum | 65.4% | 25.9% |
| Range | 58.2% | 23.6% |
| Mean | 23.0% | 9.1% |
| Median | 18.6% | 8.2% |
| Interquartile 25% (IQ1) | 9.7% | 6.8% |
| Interquartile 75% (IQ3) | 28.2% | 9.4% |
| Interquartile Range (IQR) | 18.5% | 2.6% |
| Standard Deviation (Sample) | 15.9% | 5.0% |
| Standard Deviation (Population) | 15.5% | 4.9% |
Similar Demographics by Unemployment Among Women with Children Ages 6 to 17 years
Demographics Similar to Welsh by Unemployment Among Women with Children Ages 6 to 17 years
In terms of unemployment among women with children ages 6 to 17 years, the demographic groups most similar to Welsh are Macedonian (9.3%, a difference of 0.010%), French American Indian (9.3%, a difference of 0.070%), Lumbee (9.3%, a difference of 0.090%), Estonian (9.3%, a difference of 0.13%), and Panamanian (9.3%, a difference of 0.15%).
| Demographics | Rating | Rank | Unemployment Among Women with Children Ages 6 to 17 years |
| Immigrants | Eritrea | 5.8 /100 | #223 | Tragic 9.2% |
| Immigrants | El Salvador | 5.3 /100 | #224 | Tragic 9.3% |
| Chinese | 5.2 /100 | #225 | Tragic 9.3% |
| Immigrants | Azores | 4.6 /100 | #226 | Tragic 9.3% |
| Panamanians | 4.5 /100 | #227 | Tragic 9.3% |
| Estonians | 4.4 /100 | #228 | Tragic 9.3% |
| Lumbee | 4.3 /100 | #229 | Tragic 9.3% |
| Welsh | 4.0 /100 | #230 | Tragic 9.3% |
| Macedonians | 3.9 /100 | #231 | Tragic 9.3% |
| French American Indians | 3.7 /100 | #232 | Tragic 9.3% |
| Immigrants | St. Vincent and the Grenadines | 3.3 /100 | #233 | Tragic 9.3% |
| Mexicans | 3.2 /100 | #234 | Tragic 9.3% |
| Uruguayans | 3.0 /100 | #235 | Tragic 9.3% |
| Hungarians | 3.0 /100 | #236 | Tragic 9.3% |
| Immigrants | Belize | 2.8 /100 | #237 | Tragic 9.3% |
Demographics Similar to Immigrants from Eastern Europe by Unemployment Among Women with Children Ages 6 to 17 years
In terms of unemployment among women with children ages 6 to 17 years, the demographic groups most similar to Immigrants from Eastern Europe are Potawatomi (8.5%, a difference of 0.030%), Yugoslavian (8.5%, a difference of 0.060%), Paiute (8.5%, a difference of 0.10%), Australian (8.5%, a difference of 0.14%), and Immigrants from Vietnam (8.5%, a difference of 0.18%).
| Demographics | Rating | Rank | Unemployment Among Women with Children Ages 6 to 17 years |
| Japanese | 99.5 /100 | #84 | Exceptional 8.4% |
| Immigrants | North Macedonia | 99.4 /100 | #85 | Exceptional 8.5% |
| Alaskan Athabascans | 99.4 /100 | #86 | Exceptional 8.5% |
| Immigrants | Israel | 99.1 /100 | #87 | Exceptional 8.5% |
| Immigrants | Vietnam | 99.1 /100 | #88 | Exceptional 8.5% |
| Paiute | 99.1 /100 | #89 | Exceptional 8.5% |
| Yugoslavians | 99.0 /100 | #90 | Exceptional 8.5% |
| Immigrants | Eastern Europe | 99.0 /100 | #91 | Exceptional 8.5% |
| Potawatomi | 99.0 /100 | #92 | Exceptional 8.5% |
| Australians | 98.9 /100 | #93 | Exceptional 8.5% |
| Immigrants | Barbados | 98.8 /100 | #94 | Exceptional 8.5% |
| Sri Lankans | 98.7 /100 | #95 | Exceptional 8.5% |
| German Russians | 98.6 /100 | #96 | Exceptional 8.5% |
| Bolivians | 98.5 /100 | #97 | Exceptional 8.5% |
| Malaysians | 98.5 /100 | #98 | Exceptional 8.6% |