Austrian vs Okinawan Unemployment
COMPARE
Austrian
Okinawan
Unemployment
Unemployment Comparison
Austrians
Okinawans
4.8%
UNEMPLOYMENT
99.5/ 100
METRIC RATING
44th/ 347
METRIC RANK
4.9%
UNEMPLOYMENT
97.9/ 100
METRIC RATING
78th/ 347
METRIC RANK
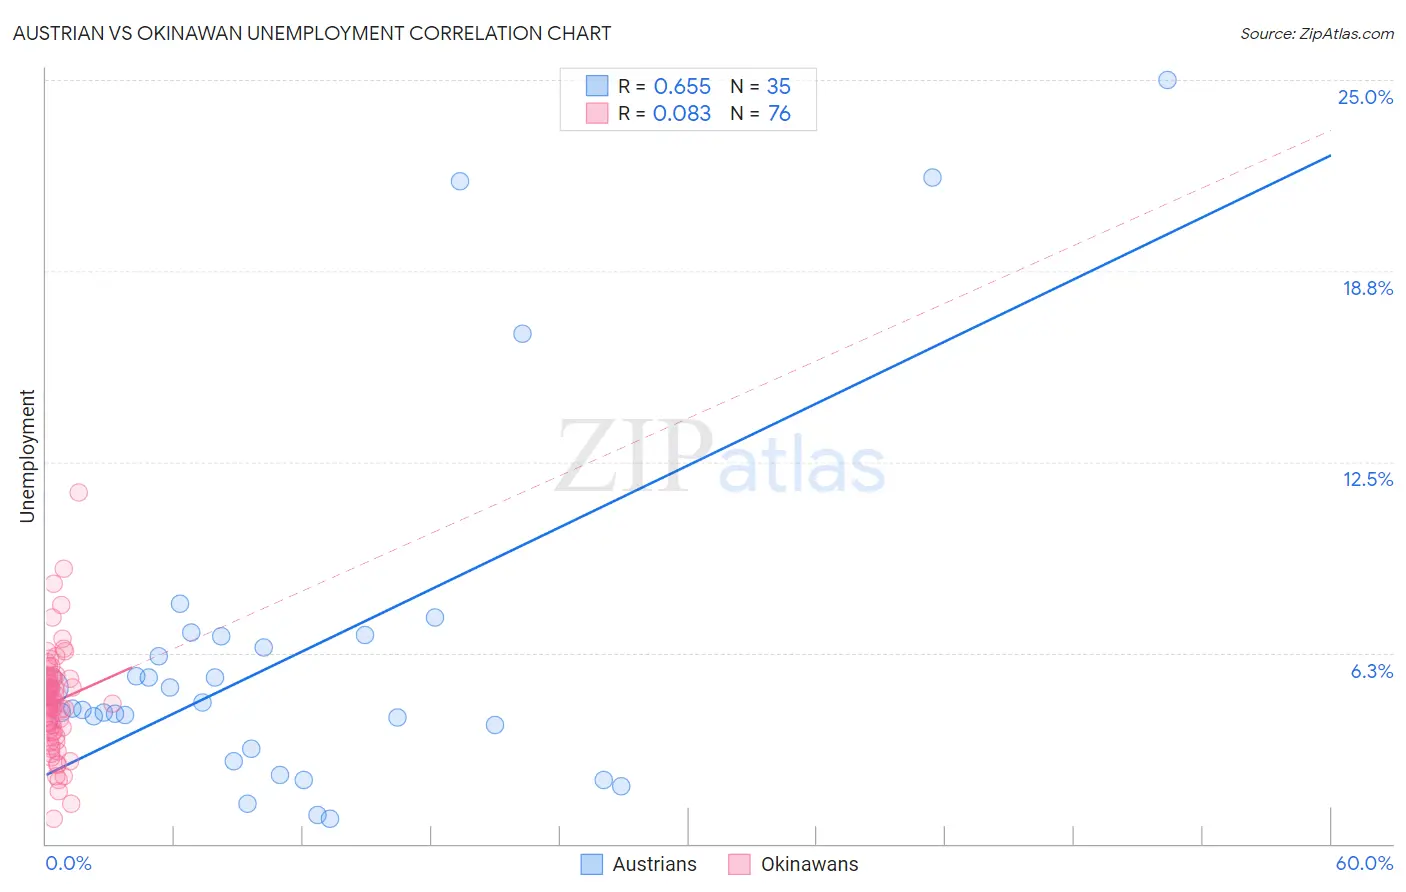
Austrian vs Okinawan Unemployment Correlation Chart
The statistical analysis conducted on geographies consisting of 451,169,494 people shows a significant positive correlation between the proportion of Austrians and unemployment in the United States with a correlation coefficient (R) of 0.655 and weighted average of 4.8%. Similarly, the statistical analysis conducted on geographies consisting of 73,771,070 people shows a slight positive correlation between the proportion of Okinawans and unemployment in the United States with a correlation coefficient (R) of 0.083 and weighted average of 4.9%, a difference of 2.4%.
Unemployment Correlation Summary
| Measurement | Austrian | Okinawan |
| Minimum | 0.80% | 0.80% |
| Maximum | 25.0% | 11.5% |
| Range | 24.2% | 10.7% |
| Mean | 6.3% | 4.6% |
| Median | 4.4% | 4.6% |
| Interquartile 25% (IQ1) | 3.1% | 3.7% |
| Interquartile 75% (IQ3) | 6.8% | 5.5% |
| Interquartile Range (IQR) | 3.7% | 1.8% |
| Standard Deviation (Sample) | 5.9% | 1.7% |
| Standard Deviation (Population) | 5.8% | 1.7% |
Similar Demographics by Unemployment
Demographics Similar to Austrians by Unemployment
In terms of unemployment, the demographic groups most similar to Austrians are French (4.8%, a difference of 0.050%), Yugoslavian (4.8%, a difference of 0.060%), Immigrants from Nepal (4.8%, a difference of 0.22%), Immigrants from Taiwan (4.8%, a difference of 0.24%), and Filipino (4.8%, a difference of 0.26%).
| Demographics | Rating | Rank | Unemployment |
| Czechoslovakians | 99.7 /100 | #37 | Exceptional 4.8% |
| Bolivians | 99.7 /100 | #38 | Exceptional 4.8% |
| Lithuanians | 99.7 /100 | #39 | Exceptional 4.8% |
| Northern Europeans | 99.7 /100 | #40 | Exceptional 4.8% |
| Immigrants | Bosnia and Herzegovina | 99.7 /100 | #41 | Exceptional 4.8% |
| Filipinos | 99.5 /100 | #42 | Exceptional 4.8% |
| Yugoslavians | 99.5 /100 | #43 | Exceptional 4.8% |
| Austrians | 99.5 /100 | #44 | Exceptional 4.8% |
| French | 99.5 /100 | #45 | Exceptional 4.8% |
| Immigrants | Nepal | 99.4 /100 | #46 | Exceptional 4.8% |
| Immigrants | Taiwan | 99.4 /100 | #47 | Exceptional 4.8% |
| Immigrants | Scotland | 99.3 /100 | #48 | Exceptional 4.9% |
| Immigrants | South Central Asia | 99.3 /100 | #49 | Exceptional 4.9% |
| French Canadians | 99.3 /100 | #50 | Exceptional 4.9% |
| Immigrants | Belgium | 99.2 /100 | #51 | Exceptional 4.9% |
Demographics Similar to Okinawans by Unemployment
In terms of unemployment, the demographic groups most similar to Okinawans are Cypriot (4.9%, a difference of 0.040%), German Russian (4.9%, a difference of 0.10%), Canadian (5.0%, a difference of 0.12%), Turkish (4.9%, a difference of 0.13%), and Immigrants from Sweden (5.0%, a difference of 0.19%).
| Demographics | Rating | Rank | Unemployment |
| Immigrants | Japan | 98.3 /100 | #71 | Exceptional 4.9% |
| Burmese | 98.3 /100 | #72 | Exceptional 4.9% |
| Paraguayans | 98.3 /100 | #73 | Exceptional 4.9% |
| Immigrants | Northern Europe | 98.2 /100 | #74 | Exceptional 4.9% |
| Turks | 98.0 /100 | #75 | Exceptional 4.9% |
| German Russians | 98.0 /100 | #76 | Exceptional 4.9% |
| Cypriots | 97.9 /100 | #77 | Exceptional 4.9% |
| Okinawans | 97.9 /100 | #78 | Exceptional 4.9% |
| Canadians | 97.7 /100 | #79 | Exceptional 5.0% |
| Immigrants | Sweden | 97.6 /100 | #80 | Exceptional 5.0% |
| Basques | 97.6 /100 | #81 | Exceptional 5.0% |
| Fijians | 97.6 /100 | #82 | Exceptional 5.0% |
| Hmong | 97.6 /100 | #83 | Exceptional 5.0% |
| Russians | 97.4 /100 | #84 | Exceptional 5.0% |
| Immigrants | Australia | 97.0 /100 | #85 | Exceptional 5.0% |