Austrian vs Honduran Unemployment
COMPARE
Austrian
Honduran
Unemployment
Unemployment Comparison
Austrians
Hondurans
4.8%
UNEMPLOYMENT
99.5/ 100
METRIC RATING
44th/ 347
METRIC RANK
5.7%
UNEMPLOYMENT
0.3/ 100
METRIC RATING
252nd/ 347
METRIC RANK
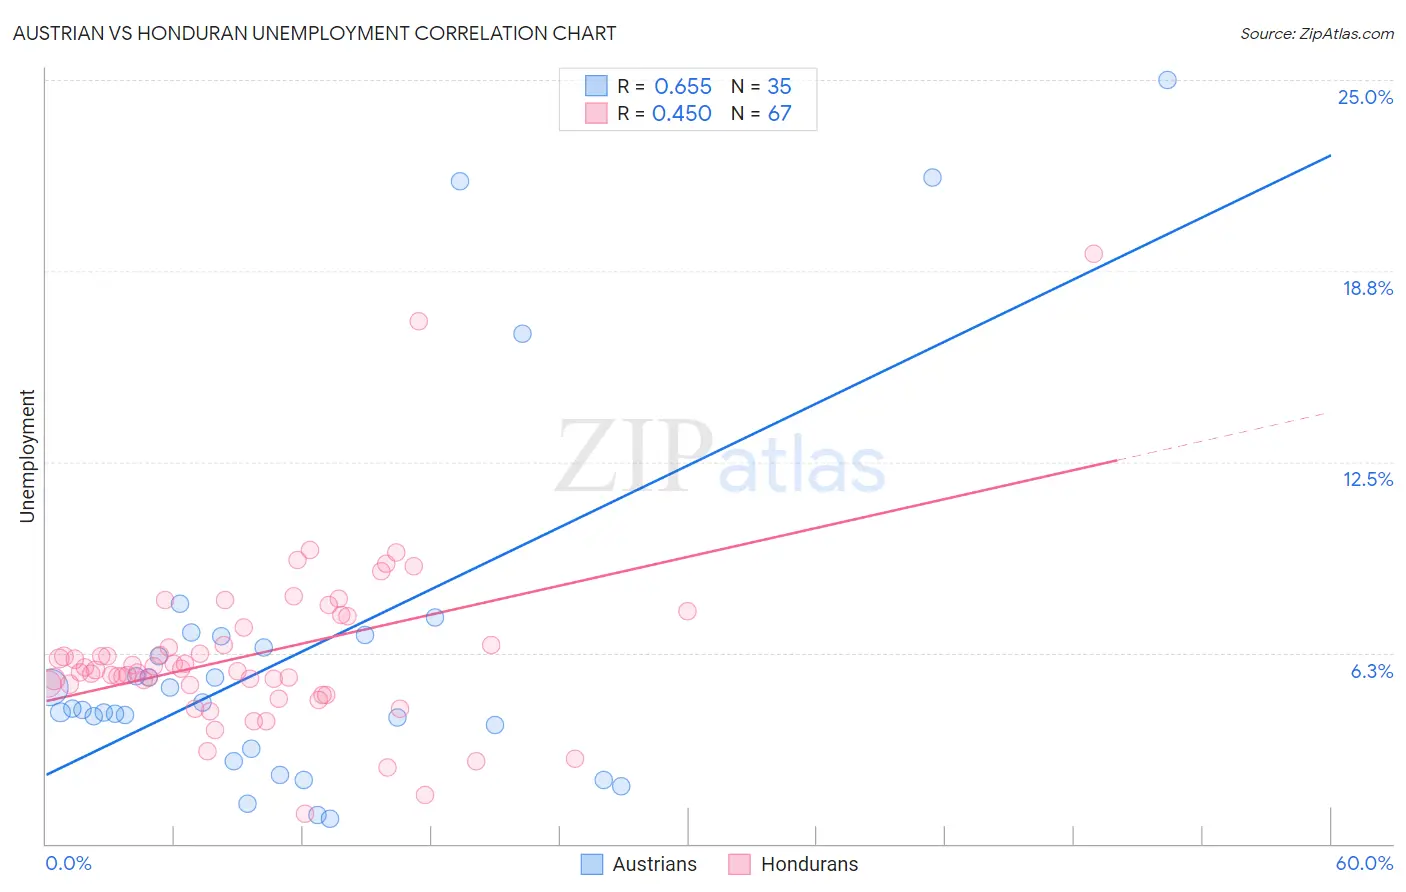
Austrian vs Honduran Unemployment Correlation Chart
The statistical analysis conducted on geographies consisting of 451,169,494 people shows a significant positive correlation between the proportion of Austrians and unemployment in the United States with a correlation coefficient (R) of 0.655 and weighted average of 4.8%. Similarly, the statistical analysis conducted on geographies consisting of 357,563,016 people shows a moderate positive correlation between the proportion of Hondurans and unemployment in the United States with a correlation coefficient (R) of 0.450 and weighted average of 5.7%, a difference of 18.2%.
Unemployment Correlation Summary
| Measurement | Austrian | Honduran |
| Minimum | 0.80% | 1.0% |
| Maximum | 25.0% | 19.3% |
| Range | 24.2% | 18.3% |
| Mean | 6.3% | 6.2% |
| Median | 4.4% | 5.7% |
| Interquartile 25% (IQ1) | 3.1% | 5.2% |
| Interquartile 75% (IQ3) | 6.8% | 7.1% |
| Interquartile Range (IQR) | 3.7% | 1.9% |
| Standard Deviation (Sample) | 5.9% | 2.8% |
| Standard Deviation (Population) | 5.8% | 2.8% |
Similar Demographics by Unemployment
Demographics Similar to Austrians by Unemployment
In terms of unemployment, the demographic groups most similar to Austrians are French (4.8%, a difference of 0.050%), Yugoslavian (4.8%, a difference of 0.060%), Immigrants from Nepal (4.8%, a difference of 0.22%), Immigrants from Taiwan (4.8%, a difference of 0.24%), and Filipino (4.8%, a difference of 0.26%).
| Demographics | Rating | Rank | Unemployment |
| Czechoslovakians | 99.7 /100 | #37 | Exceptional 4.8% |
| Bolivians | 99.7 /100 | #38 | Exceptional 4.8% |
| Lithuanians | 99.7 /100 | #39 | Exceptional 4.8% |
| Northern Europeans | 99.7 /100 | #40 | Exceptional 4.8% |
| Immigrants | Bosnia and Herzegovina | 99.7 /100 | #41 | Exceptional 4.8% |
| Filipinos | 99.5 /100 | #42 | Exceptional 4.8% |
| Yugoslavians | 99.5 /100 | #43 | Exceptional 4.8% |
| Austrians | 99.5 /100 | #44 | Exceptional 4.8% |
| French | 99.5 /100 | #45 | Exceptional 4.8% |
| Immigrants | Nepal | 99.4 /100 | #46 | Exceptional 4.8% |
| Immigrants | Taiwan | 99.4 /100 | #47 | Exceptional 4.8% |
| Immigrants | Scotland | 99.3 /100 | #48 | Exceptional 4.9% |
| Immigrants | South Central Asia | 99.3 /100 | #49 | Exceptional 4.9% |
| French Canadians | 99.3 /100 | #50 | Exceptional 4.9% |
| Immigrants | Belgium | 99.2 /100 | #51 | Exceptional 4.9% |
Demographics Similar to Hondurans by Unemployment
In terms of unemployment, the demographic groups most similar to Hondurans are Central American (5.7%, a difference of 0.010%), Immigrants from Honduras (5.7%, a difference of 0.080%), Immigrants from Portugal (5.7%, a difference of 0.53%), Kiowa (5.7%, a difference of 0.74%), and Guatemalan (5.8%, a difference of 0.74%).
| Demographics | Rating | Rank | Unemployment |
| French American Indians | 1.2 /100 | #245 | Tragic 5.6% |
| Bermudans | 1.1 /100 | #246 | Tragic 5.6% |
| Immigrants | Cameroon | 1.0 /100 | #247 | Tragic 5.6% |
| Liberians | 0.9 /100 | #248 | Tragic 5.6% |
| Cajuns | 0.8 /100 | #249 | Tragic 5.6% |
| Japanese | 0.8 /100 | #250 | Tragic 5.6% |
| Kiowa | 0.6 /100 | #251 | Tragic 5.7% |
| Hondurans | 0.3 /100 | #252 | Tragic 5.7% |
| Central Americans | 0.3 /100 | #253 | Tragic 5.7% |
| Immigrants | Honduras | 0.3 /100 | #254 | Tragic 5.7% |
| Immigrants | Portugal | 0.2 /100 | #255 | Tragic 5.7% |
| Guatemalans | 0.2 /100 | #256 | Tragic 5.8% |
| Yaqui | 0.2 /100 | #257 | Tragic 5.8% |
| Immigrants | Bahamas | 0.1 /100 | #258 | Tragic 5.8% |
| Sub-Saharan Africans | 0.1 /100 | #259 | Tragic 5.8% |