Hispanic or Latino vs Immigrants from China Unemployment Among Ages 45 to 54 years
COMPARE
Hispanic or Latino
Immigrants from China
Unemployment Among Ages 45 to 54 years
Unemployment Among Ages 45 to 54 years Comparison
Hispanics or Latinos
Immigrants from China
5.1%
UNEMPLOYMENT AMONG AGES 45 TO 54 YEARS
0.0/ 100
METRIC RATING
283rd/ 347
METRIC RANK
4.5%
UNEMPLOYMENT AMONG AGES 45 TO 54 YEARS
46.7/ 100
METRIC RATING
182nd/ 347
METRIC RANK
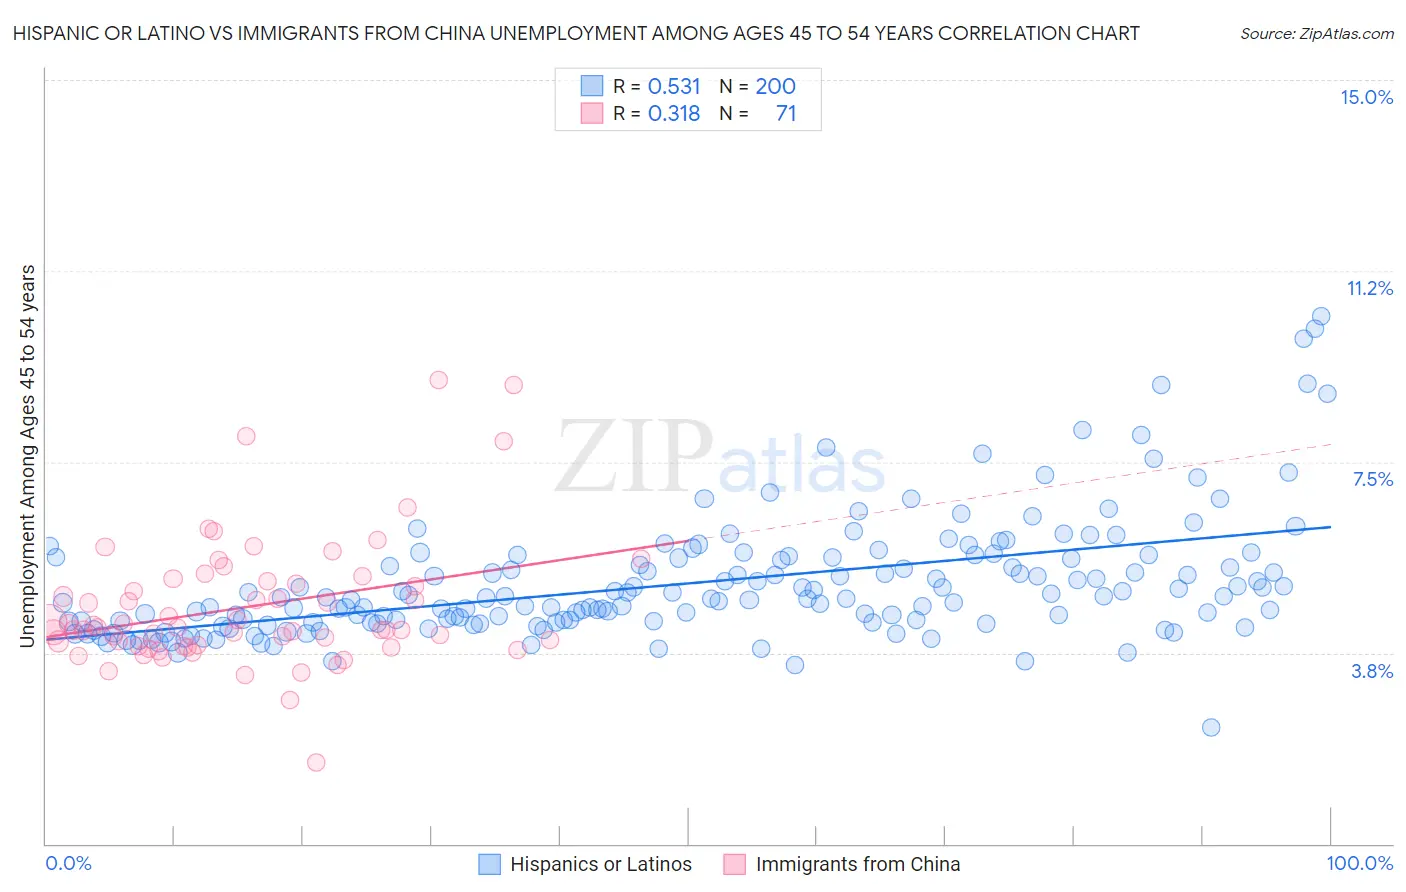
Hispanic or Latino vs Immigrants from China Unemployment Among Ages 45 to 54 years Correlation Chart
The statistical analysis conducted on geographies consisting of 534,115,777 people shows a substantial positive correlation between the proportion of Hispanics or Latinos and unemployment rate among population between the ages 45 and 54 in the United States with a correlation coefficient (R) of 0.531 and weighted average of 5.1%. Similarly, the statistical analysis conducted on geographies consisting of 442,180,379 people shows a mild positive correlation between the proportion of Immigrants from China and unemployment rate among population between the ages 45 and 54 in the United States with a correlation coefficient (R) of 0.318 and weighted average of 4.5%, a difference of 12.3%.
Unemployment Among Ages 45 to 54 years Correlation Summary
| Measurement | Hispanic or Latino | Immigrants from China |
| Minimum | 2.3% | 1.6% |
| Maximum | 10.4% | 9.1% |
| Range | 8.1% | 7.5% |
| Mean | 5.1% | 4.6% |
| Median | 4.8% | 4.2% |
| Interquartile 25% (IQ1) | 4.4% | 3.9% |
| Interquartile 75% (IQ3) | 5.6% | 5.2% |
| Interquartile Range (IQR) | 1.3% | 1.3% |
| Standard Deviation (Sample) | 1.2% | 1.3% |
| Standard Deviation (Population) | 1.2% | 1.3% |
Similar Demographics by Unemployment Among Ages 45 to 54 years
Demographics Similar to Hispanics or Latinos by Unemployment Among Ages 45 to 54 years
In terms of unemployment among ages 45 to 54 years, the demographic groups most similar to Hispanics or Latinos are African (5.1%, a difference of 0.41%), Spanish American Indian (5.1%, a difference of 0.56%), Blackfeet (5.1%, a difference of 0.64%), Kiowa (5.1%, a difference of 0.65%), and Iroquois (5.1%, a difference of 0.67%).
| Demographics | Rating | Rank | Unemployment Among Ages 45 to 54 years |
| French American Indians | 0.0 /100 | #276 | Tragic 5.0% |
| Immigrants | Mexico | 0.0 /100 | #277 | Tragic 5.0% |
| Dutch West Indians | 0.0 /100 | #278 | Tragic 5.0% |
| Nepalese | 0.0 /100 | #279 | Tragic 5.0% |
| Blackfeet | 0.0 /100 | #280 | Tragic 5.1% |
| Spanish American Indians | 0.0 /100 | #281 | Tragic 5.1% |
| Africans | 0.0 /100 | #282 | Tragic 5.1% |
| Hispanics or Latinos | 0.0 /100 | #283 | Tragic 5.1% |
| Kiowa | 0.0 /100 | #284 | Tragic 5.1% |
| Iroquois | 0.0 /100 | #285 | Tragic 5.1% |
| Senegalese | 0.0 /100 | #286 | Tragic 5.1% |
| Haitians | 0.0 /100 | #287 | Tragic 5.2% |
| Immigrants | Caribbean | 0.0 /100 | #288 | Tragic 5.2% |
| Immigrants | Haiti | 0.0 /100 | #289 | Tragic 5.2% |
| Immigrants | Portugal | 0.0 /100 | #290 | Tragic 5.2% |
Demographics Similar to Immigrants from China by Unemployment Among Ages 45 to 54 years
In terms of unemployment among ages 45 to 54 years, the demographic groups most similar to Immigrants from China are Sierra Leonean (4.5%, a difference of 0.0%), Immigrants from Poland (4.5%, a difference of 0.010%), Malaysian (4.5%, a difference of 0.030%), Immigrants from Hong Kong (4.5%, a difference of 0.040%), and Immigrants from Russia (4.5%, a difference of 0.070%).
| Demographics | Rating | Rank | Unemployment Among Ages 45 to 54 years |
| Immigrants | France | 49.4 /100 | #175 | Average 4.5% |
| Puget Sound Salish | 49.1 /100 | #176 | Average 4.5% |
| Immigrants | Northern Africa | 49.0 /100 | #177 | Average 4.5% |
| Immigrants | Australia | 48.5 /100 | #178 | Average 4.5% |
| Immigrants | Russia | 48.2 /100 | #179 | Average 4.5% |
| Malaysians | 47.5 /100 | #180 | Average 4.5% |
| Immigrants | Poland | 47.0 /100 | #181 | Average 4.5% |
| Immigrants | China | 46.7 /100 | #182 | Average 4.5% |
| Sierra Leoneans | 46.7 /100 | #183 | Average 4.5% |
| Immigrants | Hong Kong | 45.9 /100 | #184 | Average 4.5% |
| Immigrants | Philippines | 41.0 /100 | #185 | Average 4.5% |
| Hawaiians | 39.1 /100 | #186 | Fair 4.5% |
| Immigrants | Ukraine | 36.8 /100 | #187 | Fair 4.5% |
| Immigrants | Sierra Leone | 36.3 /100 | #188 | Fair 4.6% |
| Immigrants | Laos | 35.7 /100 | #189 | Fair 4.6% |