Immigrants from Belarus vs Immigrants from China Unemployment Among Ages 45 to 54 years
COMPARE
Immigrants from Belarus
Immigrants from China
Unemployment Among Ages 45 to 54 years
Unemployment Among Ages 45 to 54 years Comparison
Immigrants from Belarus
Immigrants from China
4.6%
UNEMPLOYMENT AMONG AGES 45 TO 54 YEARS
30.6/ 100
METRIC RATING
198th/ 347
METRIC RANK
4.5%
UNEMPLOYMENT AMONG AGES 45 TO 54 YEARS
46.7/ 100
METRIC RATING
182nd/ 347
METRIC RANK
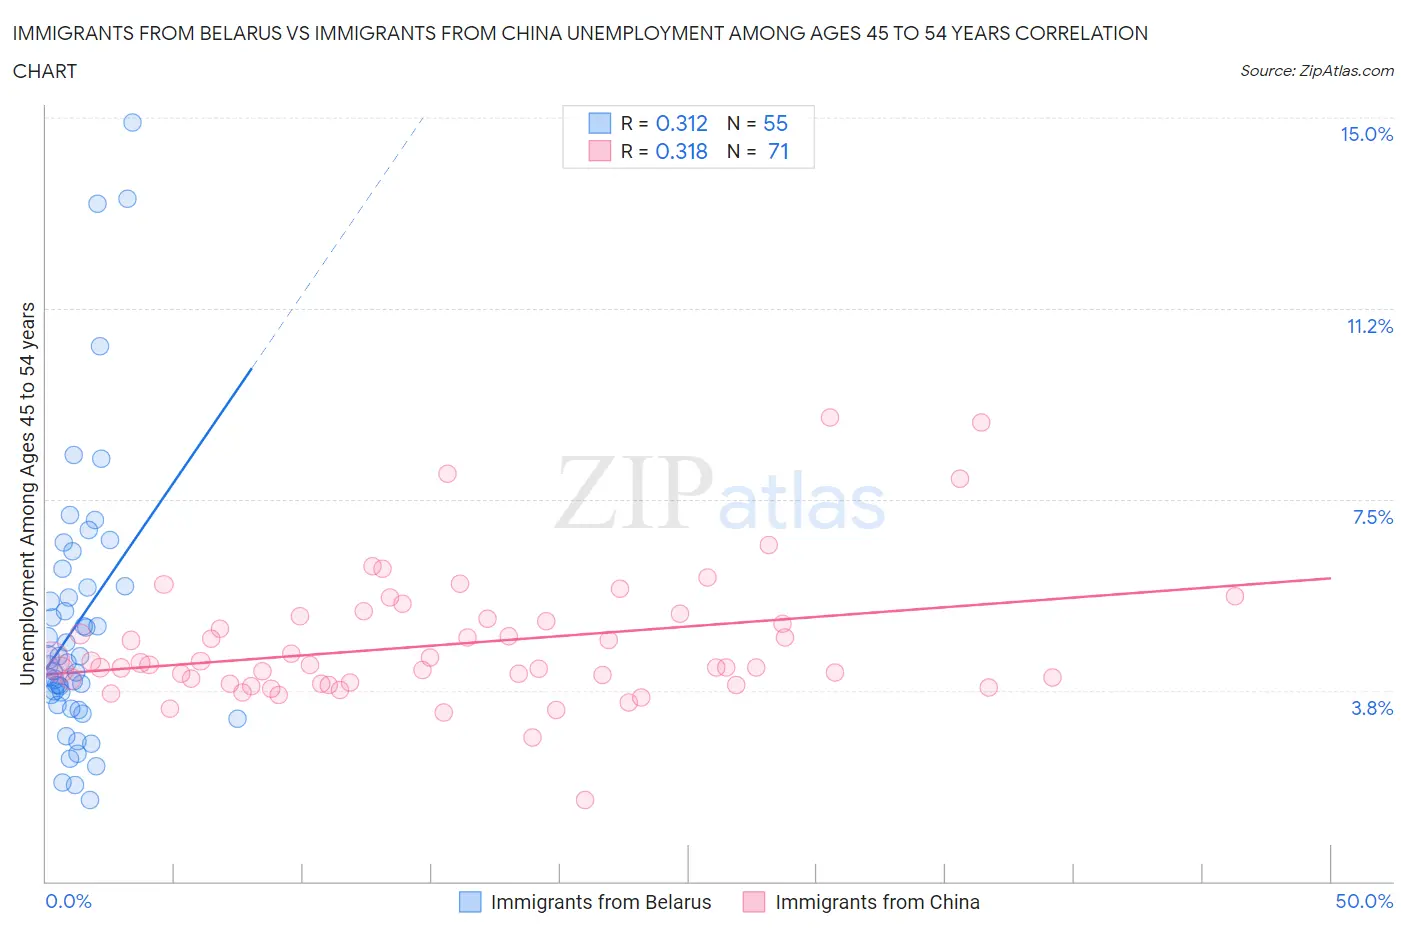
Immigrants from Belarus vs Immigrants from China Unemployment Among Ages 45 to 54 years Correlation Chart
The statistical analysis conducted on geographies consisting of 148,948,827 people shows a mild positive correlation between the proportion of Immigrants from Belarus and unemployment rate among population between the ages 45 and 54 in the United States with a correlation coefficient (R) of 0.312 and weighted average of 4.6%. Similarly, the statistical analysis conducted on geographies consisting of 442,180,379 people shows a mild positive correlation between the proportion of Immigrants from China and unemployment rate among population between the ages 45 and 54 in the United States with a correlation coefficient (R) of 0.318 and weighted average of 4.5%, a difference of 0.80%.
Unemployment Among Ages 45 to 54 years Correlation Summary
| Measurement | Immigrants from Belarus | Immigrants from China |
| Minimum | 1.6% | 1.6% |
| Maximum | 14.9% | 9.1% |
| Range | 13.3% | 7.5% |
| Mean | 5.1% | 4.6% |
| Median | 4.3% | 4.2% |
| Interquartile 25% (IQ1) | 3.5% | 3.9% |
| Interquartile 75% (IQ3) | 5.8% | 5.2% |
| Interquartile Range (IQR) | 2.3% | 1.3% |
| Standard Deviation (Sample) | 2.8% | 1.3% |
| Standard Deviation (Population) | 2.7% | 1.3% |
Demographics Similar to Immigrants from Belarus and Immigrants from China by Unemployment Among Ages 45 to 54 years
In terms of unemployment among ages 45 to 54 years, the demographic groups most similar to Immigrants from Belarus are Albanian (4.6%, a difference of 0.020%), Estonian (4.6%, a difference of 0.030%), Peruvian (4.6%, a difference of 0.050%), South American (4.6%, a difference of 0.12%), and Immigrants from Lithuania (4.6%, a difference of 0.14%). Similarly, the demographic groups most similar to Immigrants from China are Sierra Leonean (4.5%, a difference of 0.0%), Immigrants from Poland (4.5%, a difference of 0.010%), Malaysian (4.5%, a difference of 0.030%), Immigrants from Hong Kong (4.5%, a difference of 0.040%), and Immigrants from Philippines (4.5%, a difference of 0.27%).
| Demographics | Rating | Rank | Unemployment Among Ages 45 to 54 years |
| Malaysians | 47.5 /100 | #180 | Average 4.5% |
| Immigrants | Poland | 47.0 /100 | #181 | Average 4.5% |
| Immigrants | China | 46.7 /100 | #182 | Average 4.5% |
| Sierra Leoneans | 46.7 /100 | #183 | Average 4.5% |
| Immigrants | Hong Kong | 45.9 /100 | #184 | Average 4.5% |
| Immigrants | Philippines | 41.0 /100 | #185 | Average 4.5% |
| Hawaiians | 39.1 /100 | #186 | Fair 4.5% |
| Immigrants | Ukraine | 36.8 /100 | #187 | Fair 4.5% |
| Immigrants | Sierra Leone | 36.3 /100 | #188 | Fair 4.6% |
| Immigrants | Laos | 35.7 /100 | #189 | Fair 4.6% |
| Immigrants | Serbia | 34.8 /100 | #190 | Fair 4.6% |
| Immigrants | Uruguay | 34.4 /100 | #191 | Fair 4.6% |
| Immigrants | Thailand | 34.1 /100 | #192 | Fair 4.6% |
| Immigrants | Lithuania | 33.2 /100 | #193 | Fair 4.6% |
| South Americans | 32.9 /100 | #194 | Fair 4.6% |
| Peruvians | 31.5 /100 | #195 | Fair 4.6% |
| Estonians | 31.2 /100 | #196 | Fair 4.6% |
| Albanians | 31.1 /100 | #197 | Fair 4.6% |
| Immigrants | Belarus | 30.6 /100 | #198 | Fair 4.6% |
| Brazilians | 20.1 /100 | #199 | Fair 4.6% |
| Immigrants | Denmark | 19.8 /100 | #200 | Poor 4.6% |