Austrian vs Asian Unemployment Among Ages 45 to 54 years

COMPARE

Austrian
Race
Ancestry
AfghanAfricanAlaska NativeAlaskan AthabascanAlbanianAleutAlsatianAmericanApacheArabArapahoArgentineanArmenianAssyrian/Chaldean/SyriacAustralianAustrianBahamianBangladeshiBarbadianBasqueBelgianBelizeanBermudanBhutaneseBlackfeetBolivianBrazilianBritishBritish West IndianBulgarianBurmeseCajunCambodianCanadianCape VerdeanCarpatho RusynCelticCentral AmericanCentral American IndianCherokeeCheyenneChickasawChileanChineseChippewaChoctawColombianColvilleComancheCosta RicanCreeCreekCroatianCrowCubanCypriotCzechCzechoslovakianDanishDelawareDominicanDutchDutch West IndianEastern EuropeanEcuadorianEgyptianEnglishEstonianEthiopianEuropeanFijianFilipinoFinnishFrenchFrench American IndianFrench CanadianGermanGerman RussianGhanaianGreekGuamanian/ChamorroGuatemalanGuyaneseHaitianHmongHonduranHopiHoumaHungarianIcelanderIndian (Asian)IndonesianInupiatIranianIraqiIrishIroquoisIsraeliItalianJamaicanJapaneseJordanianKenyanKiowaKoreanLaotianLatvianLebaneseLiberianLithuanianLumbeeLuxembourgerMacedonianMalaysianMalteseMarshalleseMenomineeMexicanMexican American IndianMongolianMoroccanNative HawaiianNavajoNepaleseNew ZealanderNicaraguanNigerianNorthern EuropeanNorwegianOkinawanOsageOttawaPaiutePakistaniPalestinianPanamanianParaguayanPennsylvania GermanPeruvianPimaPolishPortuguesePotawatomiPuebloPuerto RicanPuget Sound SalishRomanianRussianSalvadoranSamoanScandinavianScotch-IrishScottishSeminoleSenegaleseSerbianShoshoneSierra LeoneanSiouxSlavicSlovakSloveneSomaliSouth AfricanSouth AmericanSouth American IndianSoviet UnionSpaniardSpanishSpanish AmericanSpanish American IndianSri LankanSubsaharan AfricanSudaneseSwedishSwissSyrianTaiwaneseThaiTlingit-HaidaTohono O'OdhamTonganTrinidadian and TobagonianTsimshianTurkishU.S. Virgin IslanderUgandanUkrainianUruguayanUteVenezuelanVietnameseWelshWest IndianYakamaYaquiYugoslavianYumanYup'ikZimbabwean
Immigration
NonimmigrantsImmigrantsAfghanistanAfricaAlbaniaArgentinaArmeniaAsiaAustraliaAustriaBahamasBangladeshBarbadosBelarusBelgiumBelizeBoliviaBosnia and HerzegovinaBrazilBulgariaBurma/MyanmarCabo VerdeCambodiaCameroonCanadaCaribbeanCentral AmericaChileChinaColombiaCongoCosta RicaCroatiaCubaCzechoslovakiaDenmarkDominicaDominican RepublicEastern AfricaEastern AsiaEastern EuropeEcuadorEgyptEl SalvadorEnglandEritreaEthiopiaEuropeFijiFranceGermanyGhanaGreeceGrenadaGuatemalaGuyanaHaitiHondurasHong KongHungaryIndiaIndonesiaIranIraqIrelandIsraelItalyJamaicaJapanJordanKazakhstanKenyaKoreaKuwaitLaosLatin AmericaLatviaLebanonLiberiaLithuaniaMalaysiaMexicoMicronesiaMiddle AfricaMoldovaMoroccoNepalNetherlandsNicaraguaNigeriaNorth AmericaNorth MacedoniaNorthern AfricaNorthern EuropeNorwayOceaniaPakistanPanamaPeruPhilippinesPolandPortugalRomaniaRussiaSaudi ArabiaScotlandSenegalSerbiaSierra LeoneSingaporeSomaliaSouth AfricaSouth AmericaSouth Central AsiaSouth Eastern AsiaSouthern EuropeSpainSri LankaSt. Vincent and the GrenadinesSudanSwedenSwitzerlandSyriaTaiwanThailandTrinidad and TobagoTurkeyUgandaUkraineUruguayUzbekistanVenezuelaVietnamWest IndiesWestern AfricaWestern AsiaWestern EuropeYemenZaireZimbabweAzores
Asian
Race
Ancestry
AfghanAfricanAlaska NativeAlaskan AthabascanAlbanianAleutAlsatianAmericanApacheArabArapahoArgentineanArmenianAssyrian/Chaldean/SyriacAustralianBahamianBangladeshiBarbadianBasqueBelgianBelizeanBermudanBhutaneseBlackfeetBolivianBrazilianBritishBritish West IndianBulgarianBurmeseCajunCambodianCanadianCape VerdeanCarpatho RusynCelticCentral AmericanCentral American IndianCherokeeCheyenneChickasawChileanChineseChippewaChoctawColombianColvilleComancheCosta RicanCreeCreekCroatianCrowCubanCypriotCzechCzechoslovakianDanishDelawareDominicanDutchDutch West IndianEastern EuropeanEcuadorianEgyptianEnglishEstonianEthiopianEuropeanFijianFilipinoFinnishFrenchFrench American IndianFrench CanadianGermanGerman RussianGhanaianGreekGuamanian/ChamorroGuatemalanGuyaneseHaitianHmongHonduranHopiHoumaHungarianIcelanderIndian (Asian)IndonesianInupiatIranianIraqiIrishIroquoisIsraeliItalianJamaicanJapaneseJordanianKenyanKiowaKoreanLaotianLatvianLebaneseLiberianLithuanianLumbeeLuxembourgerMacedonianMalaysianMalteseMarshalleseMenomineeMexicanMexican American IndianMongolianMoroccanNative HawaiianNavajoNepaleseNew ZealanderNicaraguanNigerianNorthern EuropeanNorwegianOkinawanOsageOttawaPaiutePakistaniPalestinianPanamanianParaguayanPennsylvania GermanPeruvianPimaPolishPortuguesePotawatomiPuebloPuerto RicanPuget Sound SalishRomanianRussianSalvadoranSamoanScandinavianScotch-IrishScottishSeminoleSenegaleseSerbianShoshoneSierra LeoneanSiouxSlavicSlovakSloveneSomaliSouth AfricanSouth AmericanSouth American IndianSoviet UnionSpaniardSpanishSpanish AmericanSpanish American IndianSri LankanSubsaharan AfricanSudaneseSwedishSwissSyrianTaiwaneseThaiTlingit-HaidaTohono O'OdhamTonganTrinidadian and TobagonianTsimshianTurkishU.S. Virgin IslanderUgandanUkrainianUruguayanUteVenezuelanVietnameseWelshWest IndianYakamaYaquiYugoslavianYumanYup'ikZimbabwean
Immigration
NonimmigrantsImmigrantsAfghanistanAfricaAlbaniaArgentinaArmeniaAsiaAustraliaAustriaBahamasBangladeshBarbadosBelarusBelgiumBelizeBoliviaBosnia and HerzegovinaBrazilBulgariaBurma/MyanmarCabo VerdeCambodiaCameroonCanadaCaribbeanCentral AmericaChileChinaColombiaCongoCosta RicaCroatiaCubaCzechoslovakiaDenmarkDominicaDominican RepublicEastern AfricaEastern AsiaEastern EuropeEcuadorEgyptEl SalvadorEnglandEritreaEthiopiaEuropeFijiFranceGermanyGhanaGreeceGrenadaGuatemalaGuyanaHaitiHondurasHong KongHungaryIndiaIndonesiaIranIraqIrelandIsraelItalyJamaicaJapanJordanKazakhstanKenyaKoreaKuwaitLaosLatin AmericaLatviaLebanonLiberiaLithuaniaMalaysiaMexicoMicronesiaMiddle AfricaMoldovaMoroccoNepalNetherlandsNicaraguaNigeriaNorth AmericaNorth MacedoniaNorthern AfricaNorthern EuropeNorwayOceaniaPakistanPanamaPeruPhilippinesPolandPortugalRomaniaRussiaSaudi ArabiaScotlandSenegalSerbiaSierra LeoneSingaporeSomaliaSouth AfricaSouth AmericaSouth Central AsiaSouth Eastern AsiaSouthern EuropeSpainSri LankaSt. Vincent and the GrenadinesSudanSwedenSwitzerlandSyriaTaiwanThailandTrinidad and TobagoTurkeyUgandaUkraineUruguayUzbekistanVenezuelaVietnamWest IndiesWestern AfricaWestern AsiaWestern EuropeYemenZaireZimbabweAzores
Unemployment Among Ages 45 to 54 years
Income
Poverty
Unemployment
Labor Participation
Family Structure
Vehicle Availability
Education Level
Disability

Unemployment Among Ages 45 to 54 years Comparison

Austrians

Asians

Exceptional
Exceptional
4.3%
UNEMPLOYMENT AMONG AGES 45 TO 54 YEARS
99.0/ 100
METRIC RATING
64th/ 347
METRIC RANK
4.3%
UNEMPLOYMENT AMONG AGES 45 TO 54 YEARS
96.8/ 100
METRIC RATING
90th/ 347
METRIC RANK

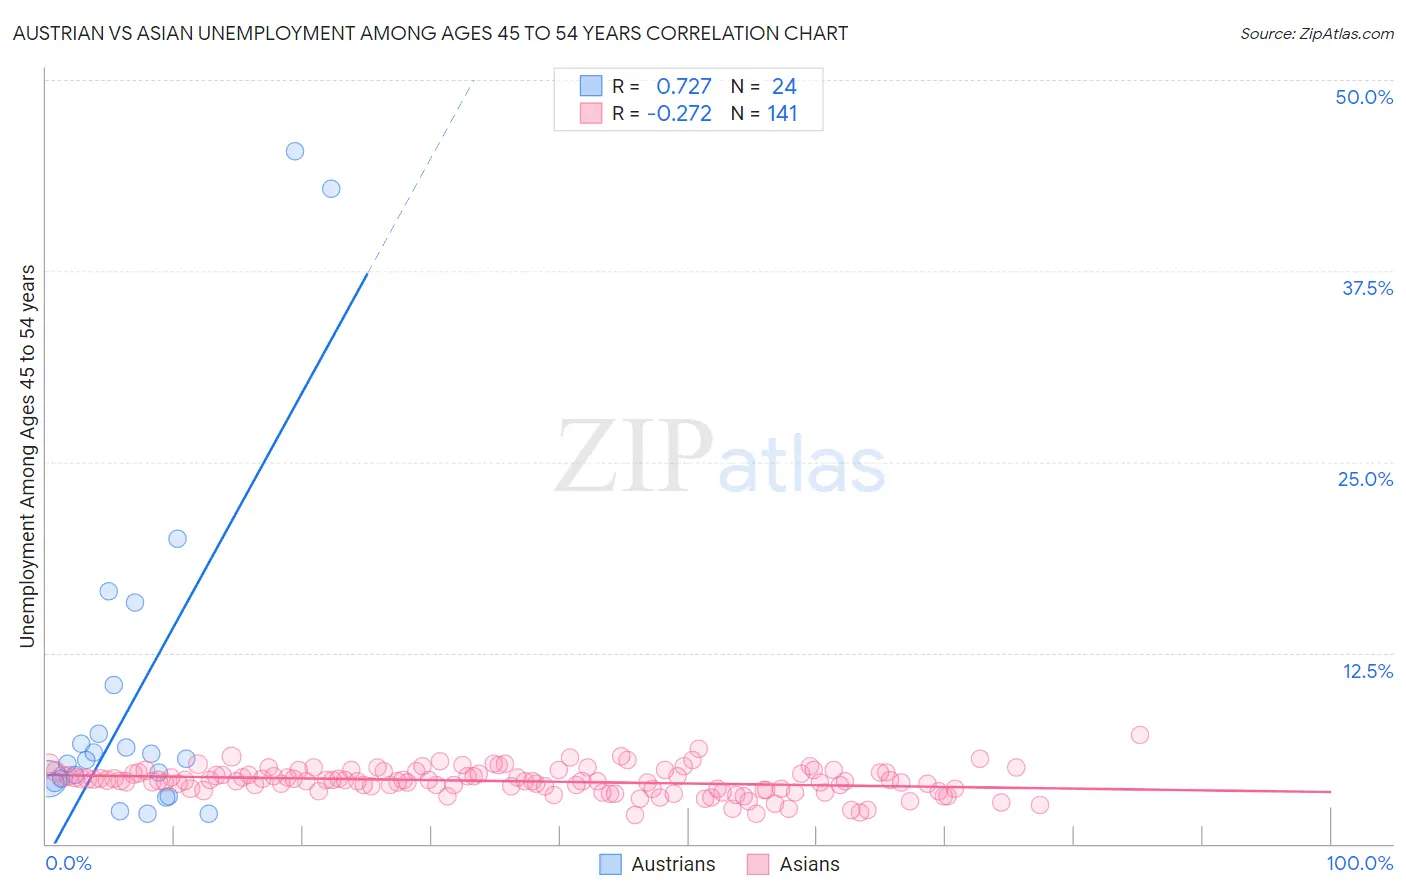
Austrian vs Asian Unemployment Among Ages 45 to 54 years Correlation Chart

The statistical analysis conducted on geographies consisting of 434,363,513 people shows a strong positive correlation between the proportion of Austrians and unemployment rate among population between the ages 45 and 54 in the United States with a correlation coefficient (R) of 0.727 and weighted average of 4.3%. Similarly, the statistical analysis conducted on geographies consisting of 517,887,046 people shows a weak negative correlation between the proportion of Asians and unemployment rate among population between the ages 45 and 54 in the United States with a correlation coefficient (R) of -0.272 and weighted average of 4.3%, a difference of 1.4%.
Austrian vs Asian Unemployment Among Ages 45 to 54 years

Unemployment Among Ages 45 to 54 years Correlation Summary

MeasurementAustrianAsian
Minimum1.9%1.9%
Maximum45.3%7.1%
Range43.4%5.2%
Mean9.7%4.1%
Median5.6%4.1%
Interquartile 25% (IQ1)4.1%3.6%
Interquartile 75% (IQ3)8.8%4.6%
Interquartile Range (IQR)4.6%1.1%
Standard Deviation (Sample)11.6%0.88%
Standard Deviation (Population)11.3%0.87%

Similar Demographics by Unemployment Among Ages 45 to 54 years

Demographics Similar to Austrians by Unemployment Among Ages 45 to 54 years

In terms of unemployment among ages 45 to 54 years, the demographic groups most similar to Austrians are Immigrants from Sudan (4.3%, a difference of 0.030%), Turkish (4.3%, a difference of 0.070%), Immigrants from Nepal (4.3%, a difference of 0.090%), Pennsylvania German (4.3%, a difference of 0.10%), and Slovak (4.3%, a difference of 0.17%).
DemographicsRating | RankUnemployment Among Ages 45 to 54 years
Immigrants | Sri Lanka
99.3
/100
|
#57
Exceptional
4.3%
Greeks
99.3
/100
|
#58
Exceptional
4.3%
Okinawans
99.2
/100
|
#59
Exceptional
4.3%
Immigrants | Korea
99.2
/100
|
#60
Exceptional
4.3%
Immigrants | Pakistan
99.2
/100
|
#61
Exceptional
4.3%
Lithuanians
99.1
/100
|
#62
Exceptional
4.3%
Pennsylvania Germans
99.1
/100
|
#63
Exceptional
4.3%
Austrians
99.0
/100
|
#64
Exceptional
4.3%
Immigrants | Sudan
99.0
/100
|
#65
Exceptional
4.3%
Turks
98.9
/100
|
#66
Exceptional
4.3%
Immigrants | Nepal
98.9
/100
|
#67
Exceptional
4.3%
Slovaks
98.8
/100
|
#68
Exceptional
4.3%
Immigrants | Japan
98.7
/100
|
#69
Exceptional
4.3%
Paraguayans
98.6
/100
|
#70
Exceptional
4.3%
Palestinians
98.5
/100
|
#71
Exceptional
4.3%

Demographics Similar to Asians by Unemployment Among Ages 45 to 54 years

In terms of unemployment among ages 45 to 54 years, the demographic groups most similar to Asians are Immigrants from Argentina (4.3%, a difference of 0.050%), Immigrants from Turkey (4.3%, a difference of 0.060%), Ukrainian (4.3%, a difference of 0.070%), Sudanese (4.3%, a difference of 0.090%), and Mongolian (4.3%, a difference of 0.090%).
DemographicsRating | RankUnemployment Among Ages 45 to 54 years
Australians
97.4
/100
|
#83
Exceptional
4.3%
Italians
97.3
/100
|
#84
Exceptional
4.3%
French
97.3
/100
|
#85
Exceptional
4.3%
Ethiopians
97.2
/100
|
#86
Exceptional
4.3%
Sudanese
97.0
/100
|
#87
Exceptional
4.3%
Immigrants | Turkey
96.9
/100
|
#88
Exceptional
4.3%
Immigrants | Argentina
96.9
/100
|
#89
Exceptional
4.3%
Asians
96.8
/100
|
#90
Exceptional
4.3%
Ukrainians
96.6
/100
|
#91
Exceptional
4.3%
Mongolians
96.6
/100
|
#92
Exceptional
4.3%
Argentineans
96.5
/100
|
#93
Exceptional
4.3%
Immigrants | Malaysia
96.2
/100
|
#94
Exceptional
4.4%
Immigrants | Ethiopia
96.1
/100
|
#95
Exceptional
4.4%
Indonesians
95.4
/100
|
#96
Exceptional
4.4%
Immigrants | Canada
95.0
/100
|
#97
Exceptional
4.4%