Austrian vs Cheyenne Unemployment Among Ages 45 to 54 years
COMPARE
Austrian
Cheyenne
Unemployment Among Ages 45 to 54 years
Unemployment Among Ages 45 to 54 years Comparison
Austrians
Cheyenne
4.3%
UNEMPLOYMENT AMONG AGES 45 TO 54 YEARS
99.0/ 100
METRIC RATING
64th/ 347
METRIC RANK
10.6%
UNEMPLOYMENT AMONG AGES 45 TO 54 YEARS
0.0/ 100
METRIC RATING
345th/ 347
METRIC RANK
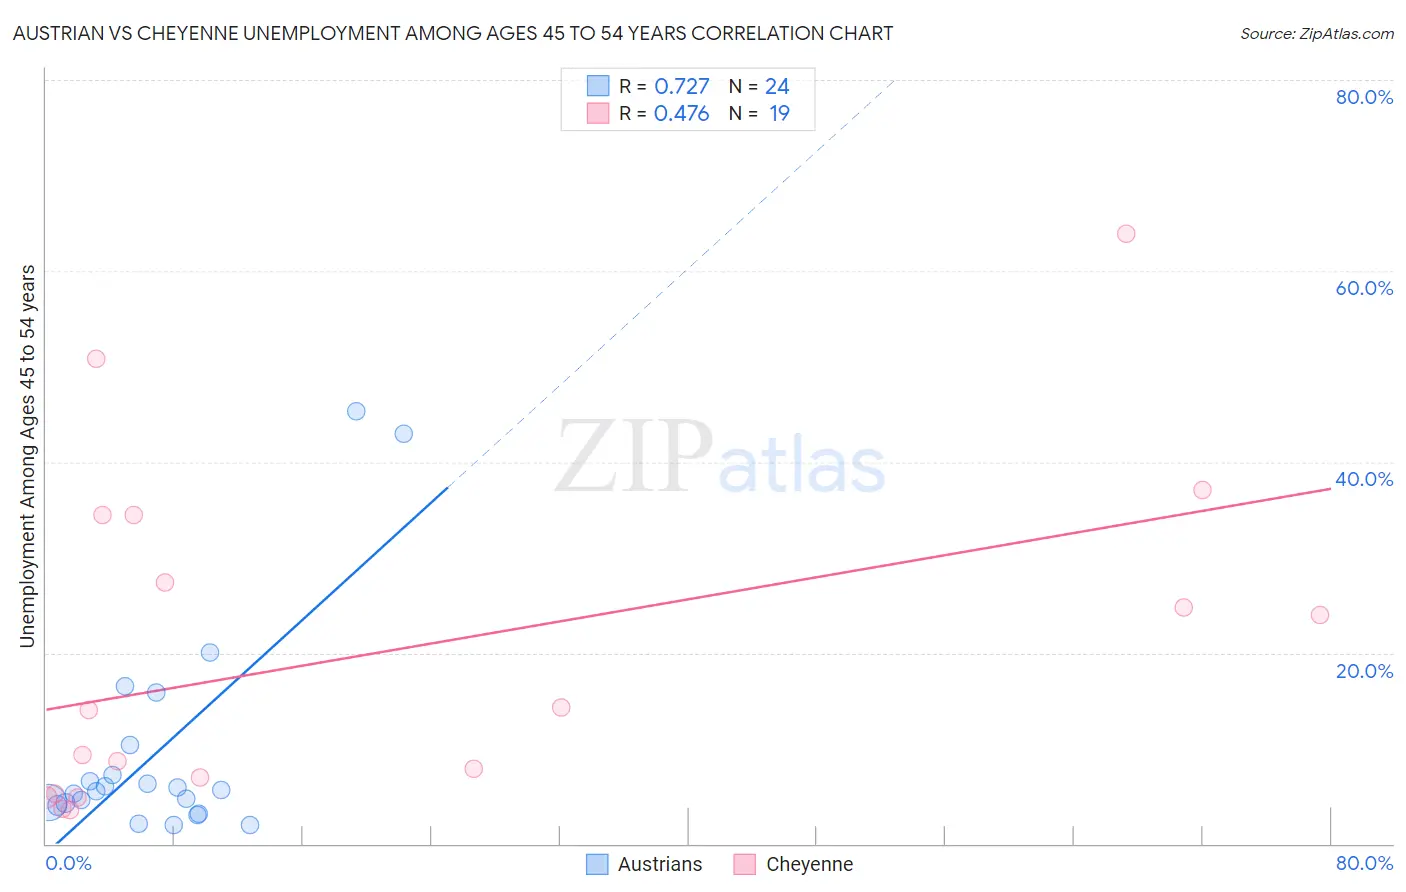
Austrian vs Cheyenne Unemployment Among Ages 45 to 54 years Correlation Chart
The statistical analysis conducted on geographies consisting of 434,363,513 people shows a strong positive correlation between the proportion of Austrians and unemployment rate among population between the ages 45 and 54 in the United States with a correlation coefficient (R) of 0.727 and weighted average of 4.3%. Similarly, the statistical analysis conducted on geographies consisting of 79,957,989 people shows a moderate positive correlation between the proportion of Cheyenne and unemployment rate among population between the ages 45 and 54 in the United States with a correlation coefficient (R) of 0.476 and weighted average of 10.6%, a difference of 146.9%.
Unemployment Among Ages 45 to 54 years Correlation Summary
| Measurement | Austrian | Cheyenne |
| Minimum | 1.9% | 3.6% |
| Maximum | 45.3% | 63.9% |
| Range | 43.4% | 60.3% |
| Mean | 9.7% | 20.0% |
| Median | 5.6% | 14.0% |
| Interquartile 25% (IQ1) | 4.1% | 5.3% |
| Interquartile 75% (IQ3) | 8.8% | 34.5% |
| Interquartile Range (IQR) | 4.6% | 29.2% |
| Standard Deviation (Sample) | 11.6% | 17.5% |
| Standard Deviation (Population) | 11.3% | 17.1% |
Similar Demographics by Unemployment Among Ages 45 to 54 years
Demographics Similar to Austrians by Unemployment Among Ages 45 to 54 years
In terms of unemployment among ages 45 to 54 years, the demographic groups most similar to Austrians are Immigrants from Sudan (4.3%, a difference of 0.030%), Turkish (4.3%, a difference of 0.070%), Immigrants from Nepal (4.3%, a difference of 0.090%), Pennsylvania German (4.3%, a difference of 0.10%), and Slovak (4.3%, a difference of 0.17%).
| Demographics | Rating | Rank | Unemployment Among Ages 45 to 54 years |
| Immigrants | Sri Lanka | 99.3 /100 | #57 | Exceptional 4.3% |
| Greeks | 99.3 /100 | #58 | Exceptional 4.3% |
| Okinawans | 99.2 /100 | #59 | Exceptional 4.3% |
| Immigrants | Korea | 99.2 /100 | #60 | Exceptional 4.3% |
| Immigrants | Pakistan | 99.2 /100 | #61 | Exceptional 4.3% |
| Lithuanians | 99.1 /100 | #62 | Exceptional 4.3% |
| Pennsylvania Germans | 99.1 /100 | #63 | Exceptional 4.3% |
| Austrians | 99.0 /100 | #64 | Exceptional 4.3% |
| Immigrants | Sudan | 99.0 /100 | #65 | Exceptional 4.3% |
| Turks | 98.9 /100 | #66 | Exceptional 4.3% |
| Immigrants | Nepal | 98.9 /100 | #67 | Exceptional 4.3% |
| Slovaks | 98.8 /100 | #68 | Exceptional 4.3% |
| Immigrants | Japan | 98.7 /100 | #69 | Exceptional 4.3% |
| Paraguayans | 98.6 /100 | #70 | Exceptional 4.3% |
| Palestinians | 98.5 /100 | #71 | Exceptional 4.3% |
Demographics Similar to Cheyenne by Unemployment Among Ages 45 to 54 years
In terms of unemployment among ages 45 to 54 years, the demographic groups most similar to Cheyenne are Yuman (9.5%, a difference of 11.3%), Yup'ik (11.9%, a difference of 12.5%), Inupiat (9.2%, a difference of 15.0%), Alaskan Athabascan (8.5%, a difference of 24.8%), and Crow (13.7%, a difference of 30.1%).
| Demographics | Rating | Rank | Unemployment Among Ages 45 to 54 years |
| Immigrants | Yemen | 0.0 /100 | #333 | Tragic 6.5% |
| Sioux | 0.0 /100 | #334 | Tragic 6.6% |
| Navajo | 0.0 /100 | #335 | Tragic 6.7% |
| Puerto Ricans | 0.0 /100 | #336 | Tragic 6.8% |
| Apache | 0.0 /100 | #337 | Tragic 7.0% |
| Colville | 0.0 /100 | #338 | Tragic 7.4% |
| Arapaho | 0.0 /100 | #339 | Tragic 7.5% |
| Hopi | 0.0 /100 | #340 | Tragic 7.5% |
| Paiute | 0.0 /100 | #341 | Tragic 7.8% |
| Alaskan Athabascans | 0.0 /100 | #342 | Tragic 8.5% |
| Inupiat | 0.0 /100 | #343 | Tragic 9.2% |
| Yuman | 0.0 /100 | #344 | Tragic 9.5% |
| Cheyenne | 0.0 /100 | #345 | Tragic 10.6% |
| Yup'ik | 0.0 /100 | #346 | Tragic 11.9% |
| Crow | 0.0 /100 | #347 | Tragic 13.7% |