Austrian vs Hispanic or Latino Unemployment Among Ages 45 to 54 years
COMPARE
Austrian
Hispanic or Latino
Unemployment Among Ages 45 to 54 years
Unemployment Among Ages 45 to 54 years Comparison
Austrians
Hispanics or Latinos
4.3%
UNEMPLOYMENT AMONG AGES 45 TO 54 YEARS
99.0/ 100
METRIC RATING
64th/ 347
METRIC RANK
5.1%
UNEMPLOYMENT AMONG AGES 45 TO 54 YEARS
0.0/ 100
METRIC RATING
283rd/ 347
METRIC RANK
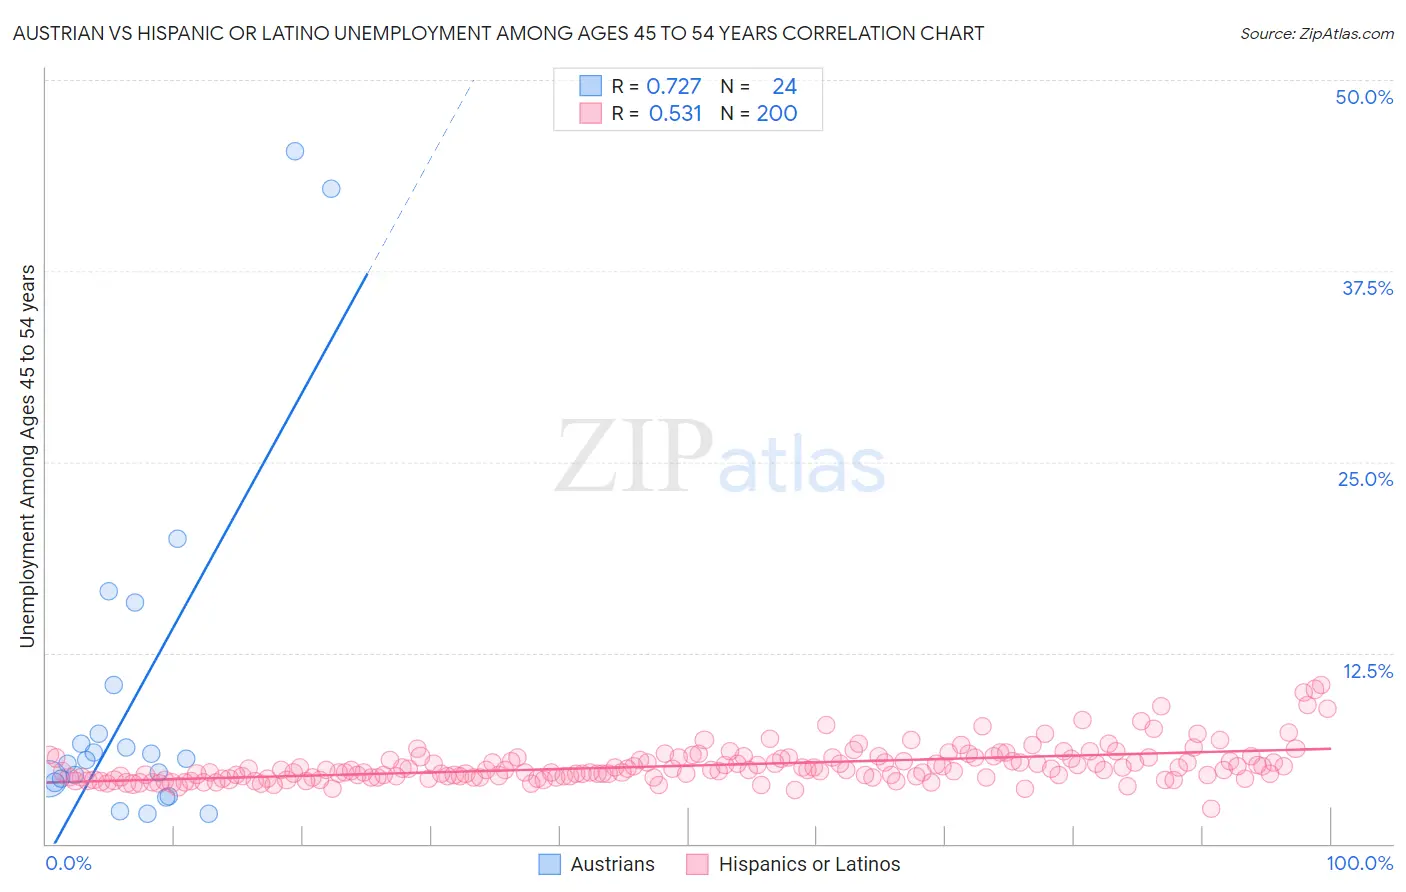
Austrian vs Hispanic or Latino Unemployment Among Ages 45 to 54 years Correlation Chart
The statistical analysis conducted on geographies consisting of 434,363,513 people shows a strong positive correlation between the proportion of Austrians and unemployment rate among population between the ages 45 and 54 in the United States with a correlation coefficient (R) of 0.727 and weighted average of 4.3%. Similarly, the statistical analysis conducted on geographies consisting of 534,115,777 people shows a substantial positive correlation between the proportion of Hispanics or Latinos and unemployment rate among population between the ages 45 and 54 in the United States with a correlation coefficient (R) of 0.531 and weighted average of 5.1%, a difference of 18.8%.
Unemployment Among Ages 45 to 54 years Correlation Summary
| Measurement | Austrian | Hispanic or Latino |
| Minimum | 1.9% | 2.3% |
| Maximum | 45.3% | 10.4% |
| Range | 43.4% | 8.1% |
| Mean | 9.7% | 5.1% |
| Median | 5.6% | 4.8% |
| Interquartile 25% (IQ1) | 4.1% | 4.4% |
| Interquartile 75% (IQ3) | 8.8% | 5.6% |
| Interquartile Range (IQR) | 4.6% | 1.3% |
| Standard Deviation (Sample) | 11.6% | 1.2% |
| Standard Deviation (Population) | 11.3% | 1.2% |
Similar Demographics by Unemployment Among Ages 45 to 54 years
Demographics Similar to Austrians by Unemployment Among Ages 45 to 54 years
In terms of unemployment among ages 45 to 54 years, the demographic groups most similar to Austrians are Immigrants from Sudan (4.3%, a difference of 0.030%), Turkish (4.3%, a difference of 0.070%), Immigrants from Nepal (4.3%, a difference of 0.090%), Pennsylvania German (4.3%, a difference of 0.10%), and Slovak (4.3%, a difference of 0.17%).
| Demographics | Rating | Rank | Unemployment Among Ages 45 to 54 years |
| Immigrants | Sri Lanka | 99.3 /100 | #57 | Exceptional 4.3% |
| Greeks | 99.3 /100 | #58 | Exceptional 4.3% |
| Okinawans | 99.2 /100 | #59 | Exceptional 4.3% |
| Immigrants | Korea | 99.2 /100 | #60 | Exceptional 4.3% |
| Immigrants | Pakistan | 99.2 /100 | #61 | Exceptional 4.3% |
| Lithuanians | 99.1 /100 | #62 | Exceptional 4.3% |
| Pennsylvania Germans | 99.1 /100 | #63 | Exceptional 4.3% |
| Austrians | 99.0 /100 | #64 | Exceptional 4.3% |
| Immigrants | Sudan | 99.0 /100 | #65 | Exceptional 4.3% |
| Turks | 98.9 /100 | #66 | Exceptional 4.3% |
| Immigrants | Nepal | 98.9 /100 | #67 | Exceptional 4.3% |
| Slovaks | 98.8 /100 | #68 | Exceptional 4.3% |
| Immigrants | Japan | 98.7 /100 | #69 | Exceptional 4.3% |
| Paraguayans | 98.6 /100 | #70 | Exceptional 4.3% |
| Palestinians | 98.5 /100 | #71 | Exceptional 4.3% |
Demographics Similar to Hispanics or Latinos by Unemployment Among Ages 45 to 54 years
In terms of unemployment among ages 45 to 54 years, the demographic groups most similar to Hispanics or Latinos are African (5.1%, a difference of 0.41%), Spanish American Indian (5.1%, a difference of 0.56%), Blackfeet (5.1%, a difference of 0.64%), Kiowa (5.1%, a difference of 0.65%), and Iroquois (5.1%, a difference of 0.67%).
| Demographics | Rating | Rank | Unemployment Among Ages 45 to 54 years |
| French American Indians | 0.0 /100 | #276 | Tragic 5.0% |
| Immigrants | Mexico | 0.0 /100 | #277 | Tragic 5.0% |
| Dutch West Indians | 0.0 /100 | #278 | Tragic 5.0% |
| Nepalese | 0.0 /100 | #279 | Tragic 5.0% |
| Blackfeet | 0.0 /100 | #280 | Tragic 5.1% |
| Spanish American Indians | 0.0 /100 | #281 | Tragic 5.1% |
| Africans | 0.0 /100 | #282 | Tragic 5.1% |
| Hispanics or Latinos | 0.0 /100 | #283 | Tragic 5.1% |
| Kiowa | 0.0 /100 | #284 | Tragic 5.1% |
| Iroquois | 0.0 /100 | #285 | Tragic 5.1% |
| Senegalese | 0.0 /100 | #286 | Tragic 5.1% |
| Haitians | 0.0 /100 | #287 | Tragic 5.2% |
| Immigrants | Caribbean | 0.0 /100 | #288 | Tragic 5.2% |
| Immigrants | Haiti | 0.0 /100 | #289 | Tragic 5.2% |
| Immigrants | Portugal | 0.0 /100 | #290 | Tragic 5.2% |