Immigrants from Asia vs Mongolian Unemployment
COMPARE
Immigrants from Asia
Mongolian
Unemployment
Unemployment Comparison
Immigrants from Asia
Mongolians
5.1%
UNEMPLOYMENT
81.8/ 100
METRIC RATING
146th/ 347
METRIC RANK
5.0%
UNEMPLOYMENT
94.8/ 100
METRIC RATING
99th/ 347
METRIC RANK
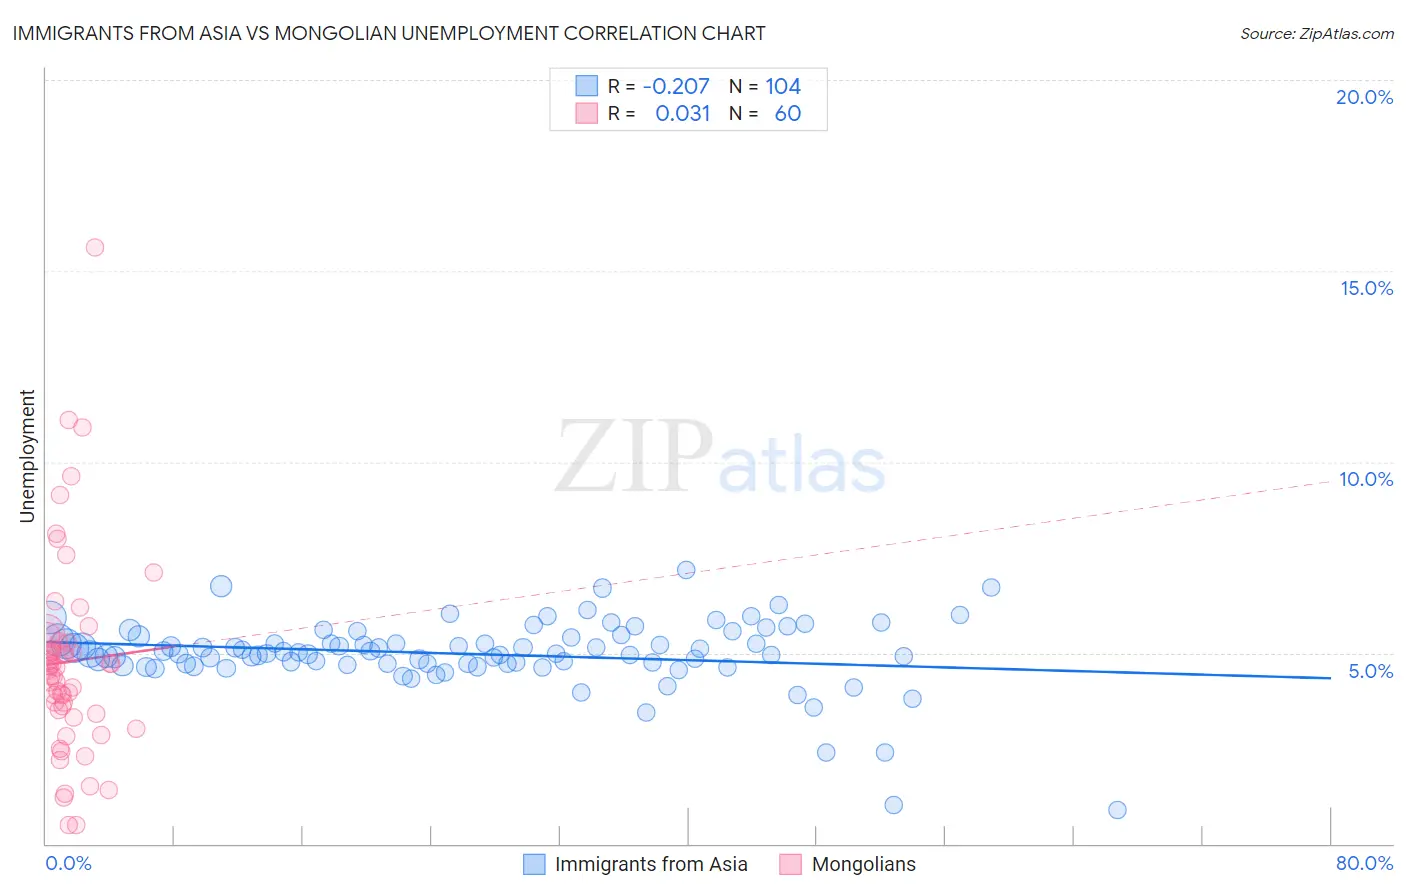
Immigrants from Asia vs Mongolian Unemployment Correlation Chart
The statistical analysis conducted on geographies consisting of 547,060,579 people shows a weak negative correlation between the proportion of Immigrants from Asia and unemployment in the United States with a correlation coefficient (R) of -0.207 and weighted average of 5.1%. Similarly, the statistical analysis conducted on geographies consisting of 140,354,726 people shows no correlation between the proportion of Mongolians and unemployment in the United States with a correlation coefficient (R) of 0.031 and weighted average of 5.0%, a difference of 2.2%.
Unemployment Correlation Summary
| Measurement | Immigrants from Asia | Mongolian |
| Minimum | 0.90% | 0.50% |
| Maximum | 7.2% | 15.6% |
| Range | 6.3% | 15.1% |
| Mean | 5.0% | 4.8% |
| Median | 5.0% | 4.6% |
| Interquartile 25% (IQ1) | 4.7% | 3.5% |
| Interquartile 75% (IQ3) | 5.4% | 5.3% |
| Interquartile Range (IQR) | 0.65% | 1.8% |
| Standard Deviation (Sample) | 0.92% | 2.6% |
| Standard Deviation (Population) | 0.92% | 2.6% |
Similar Demographics by Unemployment
Demographics Similar to Immigrants from Asia by Unemployment
In terms of unemployment, the demographic groups most similar to Immigrants from Asia are Immigrants from Norway (5.1%, a difference of 0.0%), Indian (Asian) (5.1%, a difference of 0.010%), Indonesian (5.1%, a difference of 0.060%), Immigrants from Chile (5.1%, a difference of 0.11%), and Immigrants from Pakistan (5.1%, a difference of 0.16%).
| Demographics | Rating | Rank | Unemployment |
| Pakistanis | 85.3 /100 | #139 | Excellent 5.1% |
| Immigrants | Denmark | 84.3 /100 | #140 | Excellent 5.1% |
| Palestinians | 83.4 /100 | #141 | Excellent 5.1% |
| Immigrants | Pakistan | 83.2 /100 | #142 | Excellent 5.1% |
| Immigrants | Chile | 82.8 /100 | #143 | Excellent 5.1% |
| Indonesians | 82.3 /100 | #144 | Excellent 5.1% |
| Immigrants | Norway | 81.8 /100 | #145 | Excellent 5.1% |
| Immigrants | Asia | 81.8 /100 | #146 | Excellent 5.1% |
| Indians (Asian) | 81.6 /100 | #147 | Excellent 5.1% |
| Immigrants | Italy | 79.1 /100 | #148 | Good 5.1% |
| Syrians | 77.7 /100 | #149 | Good 5.2% |
| Potawatomi | 76.2 /100 | #150 | Good 5.2% |
| Immigrants | Eastern Europe | 75.3 /100 | #151 | Good 5.2% |
| Immigrants | Hong Kong | 75.2 /100 | #152 | Good 5.2% |
| Egyptians | 75.2 /100 | #153 | Good 5.2% |
Demographics Similar to Mongolians by Unemployment
In terms of unemployment, the demographic groups most similar to Mongolians are Estonian (5.0%, a difference of 0.060%), Romanian (5.0%, a difference of 0.070%), Immigrants from Czechoslovakia (5.0%, a difference of 0.10%), Immigrants from England (5.0%, a difference of 0.13%), and American (5.0%, a difference of 0.15%).
| Demographics | Rating | Rank | Unemployment |
| Immigrants | South Africa | 96.2 /100 | #92 | Exceptional 5.0% |
| Ukrainians | 96.0 /100 | #93 | Exceptional 5.0% |
| Immigrants | Austria | 95.9 /100 | #94 | Exceptional 5.0% |
| Immigrants | Serbia | 95.6 /100 | #95 | Exceptional 5.0% |
| Immigrants | England | 95.2 /100 | #96 | Exceptional 5.0% |
| Immigrants | Czechoslovakia | 95.1 /100 | #97 | Exceptional 5.0% |
| Romanians | 95.0 /100 | #98 | Exceptional 5.0% |
| Mongolians | 94.8 /100 | #99 | Exceptional 5.0% |
| Estonians | 94.6 /100 | #100 | Exceptional 5.0% |
| Americans | 94.3 /100 | #101 | Exceptional 5.0% |
| Immigrants | Argentina | 94.1 /100 | #102 | Exceptional 5.0% |
| Chickasaw | 94.0 /100 | #103 | Exceptional 5.0% |
| Osage | 94.0 /100 | #104 | Exceptional 5.0% |
| Maltese | 94.0 /100 | #105 | Exceptional 5.0% |
| Immigrants | Romania | 93.7 /100 | #106 | Exceptional 5.0% |