Pima vs Mongolian Unemployment
COMPARE
Pima
Mongolian
Unemployment
Unemployment Comparison
Pima
Mongolians
8.2%
UNEMPLOYMENT
0.0/ 100
METRIC RATING
338th/ 347
METRIC RANK
5.0%
UNEMPLOYMENT
94.8/ 100
METRIC RATING
99th/ 347
METRIC RANK
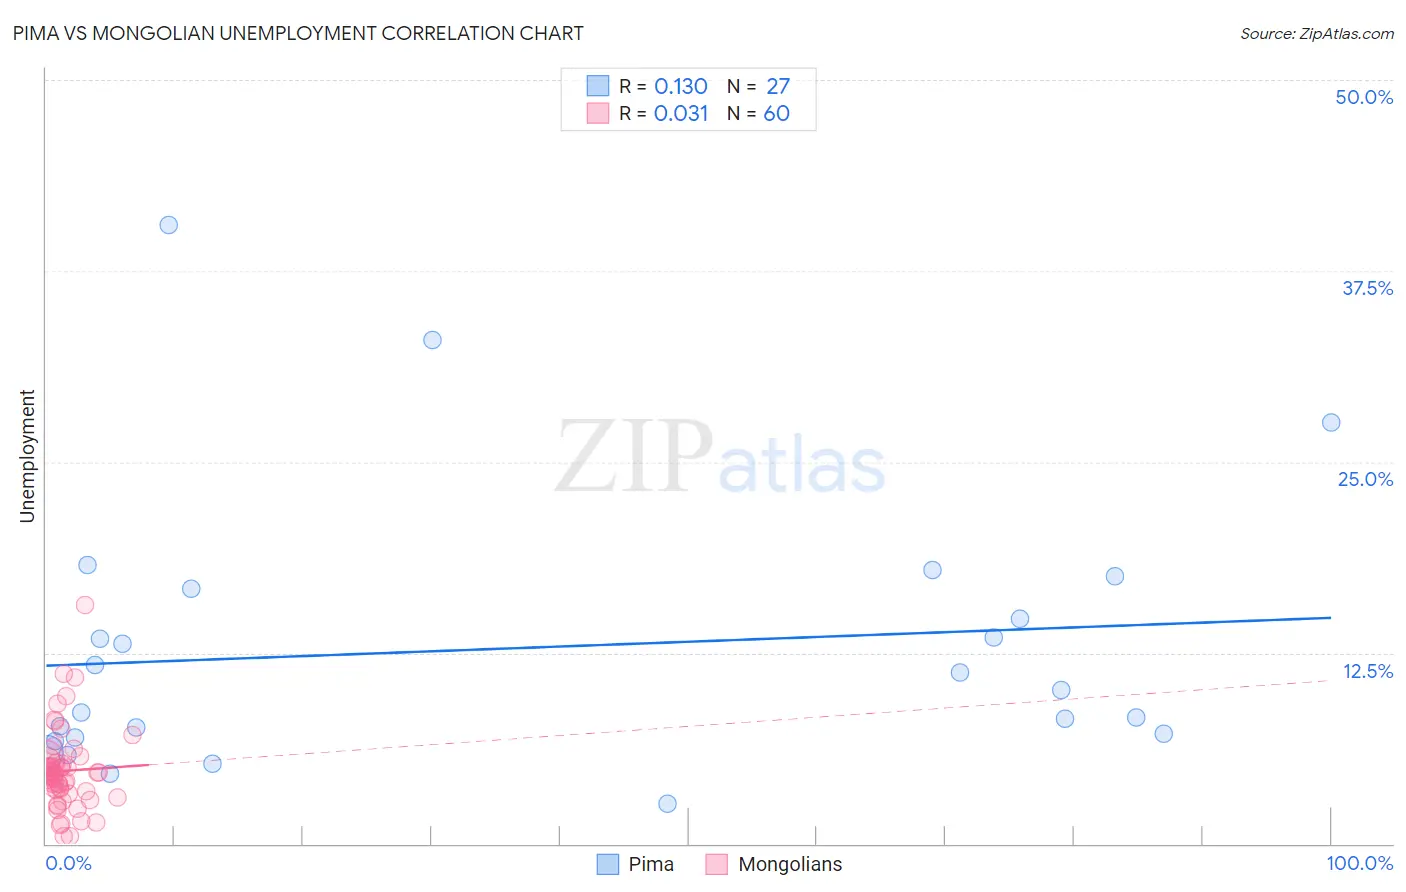
Pima vs Mongolian Unemployment Correlation Chart
The statistical analysis conducted on geographies consisting of 61,529,497 people shows a poor positive correlation between the proportion of Pima and unemployment in the United States with a correlation coefficient (R) of 0.130 and weighted average of 8.2%. Similarly, the statistical analysis conducted on geographies consisting of 140,354,726 people shows no correlation between the proportion of Mongolians and unemployment in the United States with a correlation coefficient (R) of 0.031 and weighted average of 5.0%, a difference of 63.7%.
Unemployment Correlation Summary
| Measurement | Pima | Mongolian |
| Minimum | 2.6% | 0.50% |
| Maximum | 40.5% | 15.6% |
| Range | 37.9% | 15.1% |
| Mean | 12.8% | 4.8% |
| Median | 10.1% | 4.6% |
| Interquartile 25% (IQ1) | 6.9% | 3.5% |
| Interquartile 75% (IQ3) | 16.7% | 5.3% |
| Interquartile Range (IQR) | 9.8% | 1.8% |
| Standard Deviation (Sample) | 8.9% | 2.6% |
| Standard Deviation (Population) | 8.7% | 2.6% |
Similar Demographics by Unemployment
Demographics Similar to Pima by Unemployment
In terms of unemployment, the demographic groups most similar to Pima are Navajo (8.4%, a difference of 1.6%), Puerto Rican (8.4%, a difference of 2.4%), Cheyenne (8.0%, a difference of 2.8%), Immigrants from Yemen (7.7%, a difference of 6.7%), and Alaskan Athabascan (7.7%, a difference of 7.5%).
| Demographics | Rating | Rank | Unemployment |
| Dominicans | 0.0 /100 | #331 | Tragic 7.4% |
| Sioux | 0.0 /100 | #332 | Tragic 7.4% |
| Immigrants | Dominican Republic | 0.0 /100 | #333 | Tragic 7.4% |
| Apache | 0.0 /100 | #334 | Tragic 7.4% |
| Alaskan Athabascans | 0.0 /100 | #335 | Tragic 7.7% |
| Immigrants | Yemen | 0.0 /100 | #336 | Tragic 7.7% |
| Cheyenne | 0.0 /100 | #337 | Tragic 8.0% |
| Pima | 0.0 /100 | #338 | Tragic 8.2% |
| Navajo | 0.0 /100 | #339 | Tragic 8.4% |
| Puerto Ricans | 0.0 /100 | #340 | Tragic 8.4% |
| Tohono O'odham | 0.0 /100 | #341 | Tragic 8.9% |
| Hopi | 0.0 /100 | #342 | Tragic 8.9% |
| Yuman | 0.0 /100 | #343 | Tragic 9.1% |
| Arapaho | 0.0 /100 | #344 | Tragic 9.8% |
| Inupiat | 0.0 /100 | #345 | Tragic 10.1% |
Demographics Similar to Mongolians by Unemployment
In terms of unemployment, the demographic groups most similar to Mongolians are Estonian (5.0%, a difference of 0.060%), Romanian (5.0%, a difference of 0.070%), Immigrants from Czechoslovakia (5.0%, a difference of 0.10%), Immigrants from England (5.0%, a difference of 0.13%), and American (5.0%, a difference of 0.15%).
| Demographics | Rating | Rank | Unemployment |
| Immigrants | South Africa | 96.2 /100 | #92 | Exceptional 5.0% |
| Ukrainians | 96.0 /100 | #93 | Exceptional 5.0% |
| Immigrants | Austria | 95.9 /100 | #94 | Exceptional 5.0% |
| Immigrants | Serbia | 95.6 /100 | #95 | Exceptional 5.0% |
| Immigrants | England | 95.2 /100 | #96 | Exceptional 5.0% |
| Immigrants | Czechoslovakia | 95.1 /100 | #97 | Exceptional 5.0% |
| Romanians | 95.0 /100 | #98 | Exceptional 5.0% |
| Mongolians | 94.8 /100 | #99 | Exceptional 5.0% |
| Estonians | 94.6 /100 | #100 | Exceptional 5.0% |
| Americans | 94.3 /100 | #101 | Exceptional 5.0% |
| Immigrants | Argentina | 94.1 /100 | #102 | Exceptional 5.0% |
| Chickasaw | 94.0 /100 | #103 | Exceptional 5.0% |
| Osage | 94.0 /100 | #104 | Exceptional 5.0% |
| Maltese | 94.0 /100 | #105 | Exceptional 5.0% |
| Immigrants | Romania | 93.7 /100 | #106 | Exceptional 5.0% |