Immigrants from Serbia vs French Unemployment
COMPARE
Immigrants from Serbia
French
Unemployment
Unemployment Comparison
Immigrants from Serbia
French
5.0%
UNEMPLOYMENT
95.6/ 100
METRIC RATING
95th/ 347
METRIC RANK
4.8%
UNEMPLOYMENT
99.5/ 100
METRIC RATING
45th/ 347
METRIC RANK
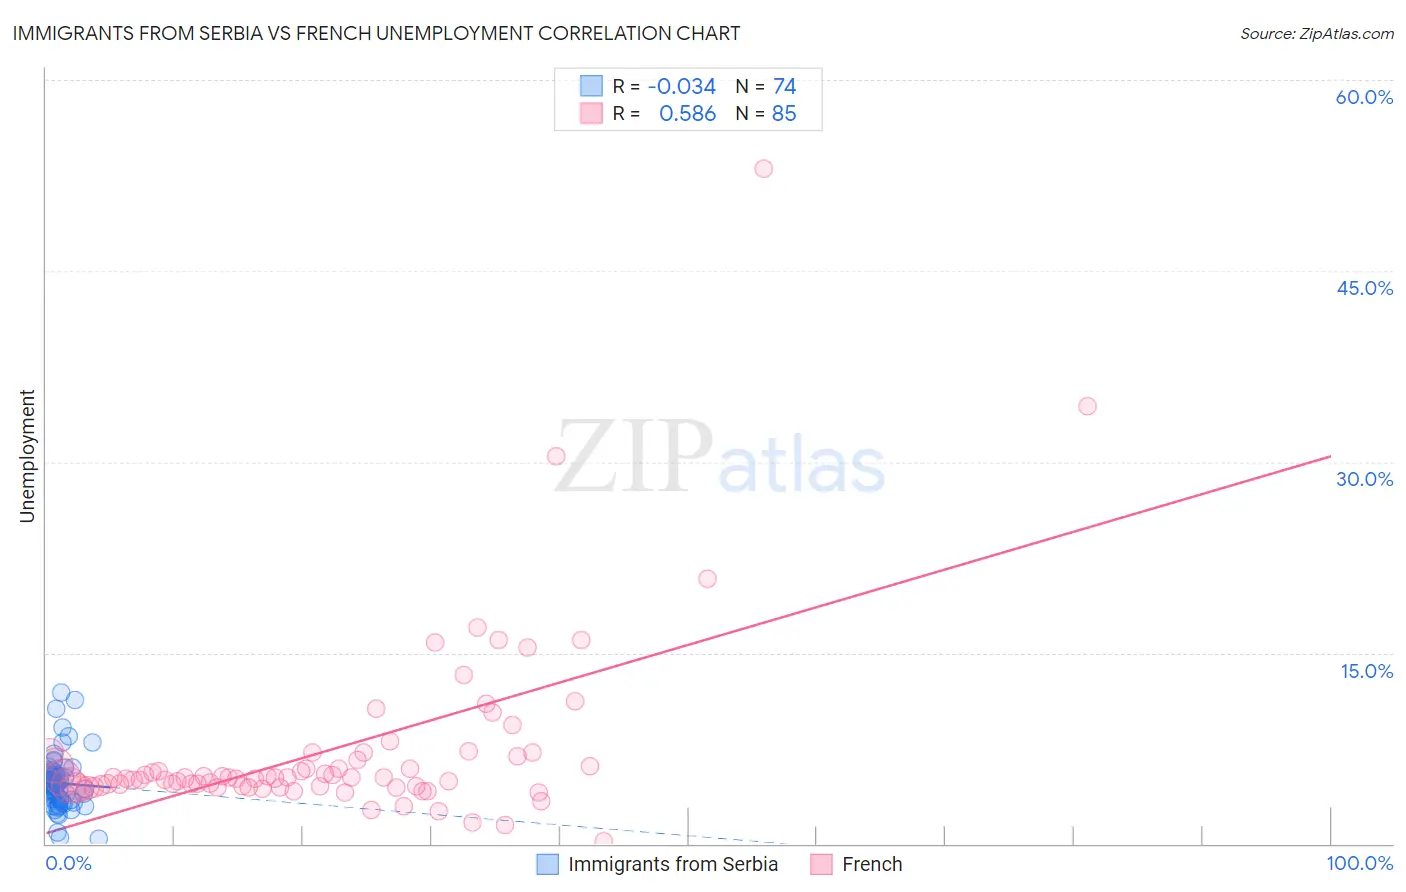
Immigrants from Serbia vs French Unemployment Correlation Chart
The statistical analysis conducted on geographies consisting of 131,730,582 people shows no correlation between the proportion of Immigrants from Serbia and unemployment in the United States with a correlation coefficient (R) of -0.034 and weighted average of 5.0%. Similarly, the statistical analysis conducted on geographies consisting of 568,292,844 people shows a substantial positive correlation between the proportion of French and unemployment in the United States with a correlation coefficient (R) of 0.586 and weighted average of 4.8%, a difference of 3.5%.
Unemployment Correlation Summary
| Measurement | Immigrants from Serbia | French |
| Minimum | 0.40% | 0.20% |
| Maximum | 11.9% | 53.0% |
| Range | 11.5% | 52.8% |
| Mean | 4.8% | 7.4% |
| Median | 4.6% | 5.2% |
| Interquartile 25% (IQ1) | 3.6% | 4.5% |
| Interquartile 75% (IQ3) | 5.4% | 7.0% |
| Interquartile Range (IQR) | 1.8% | 2.5% |
| Standard Deviation (Sample) | 2.1% | 7.3% |
| Standard Deviation (Population) | 2.1% | 7.3% |
Similar Demographics by Unemployment
Demographics Similar to Immigrants from Serbia by Unemployment
In terms of unemployment, the demographic groups most similar to Immigrants from Serbia are Immigrants from Austria (5.0%, a difference of 0.13%), Immigrants from England (5.0%, a difference of 0.16%), Ukrainian (5.0%, a difference of 0.17%), Immigrants from Czechoslovakia (5.0%, a difference of 0.19%), and Romanian (5.0%, a difference of 0.22%).
| Demographics | Rating | Rank | Unemployment |
| Immigrants | Korea | 96.6 /100 | #88 | Exceptional 5.0% |
| Jordanians | 96.4 /100 | #89 | Exceptional 5.0% |
| Immigrants | North Macedonia | 96.3 /100 | #90 | Exceptional 5.0% |
| Immigrants | Sudan | 96.3 /100 | #91 | Exceptional 5.0% |
| Immigrants | South Africa | 96.2 /100 | #92 | Exceptional 5.0% |
| Ukrainians | 96.0 /100 | #93 | Exceptional 5.0% |
| Immigrants | Austria | 95.9 /100 | #94 | Exceptional 5.0% |
| Immigrants | Serbia | 95.6 /100 | #95 | Exceptional 5.0% |
| Immigrants | England | 95.2 /100 | #96 | Exceptional 5.0% |
| Immigrants | Czechoslovakia | 95.1 /100 | #97 | Exceptional 5.0% |
| Romanians | 95.0 /100 | #98 | Exceptional 5.0% |
| Mongolians | 94.8 /100 | #99 | Exceptional 5.0% |
| Estonians | 94.6 /100 | #100 | Exceptional 5.0% |
| Americans | 94.3 /100 | #101 | Exceptional 5.0% |
| Immigrants | Argentina | 94.1 /100 | #102 | Exceptional 5.0% |
Demographics Similar to French by Unemployment
In terms of unemployment, the demographic groups most similar to French are Austrian (4.8%, a difference of 0.050%), Yugoslavian (4.8%, a difference of 0.11%), Immigrants from Nepal (4.8%, a difference of 0.16%), Immigrants from Taiwan (4.8%, a difference of 0.18%), and Filipino (4.8%, a difference of 0.31%).
| Demographics | Rating | Rank | Unemployment |
| Bolivians | 99.7 /100 | #38 | Exceptional 4.8% |
| Lithuanians | 99.7 /100 | #39 | Exceptional 4.8% |
| Northern Europeans | 99.7 /100 | #40 | Exceptional 4.8% |
| Immigrants | Bosnia and Herzegovina | 99.7 /100 | #41 | Exceptional 4.8% |
| Filipinos | 99.5 /100 | #42 | Exceptional 4.8% |
| Yugoslavians | 99.5 /100 | #43 | Exceptional 4.8% |
| Austrians | 99.5 /100 | #44 | Exceptional 4.8% |
| French | 99.5 /100 | #45 | Exceptional 4.8% |
| Immigrants | Nepal | 99.4 /100 | #46 | Exceptional 4.8% |
| Immigrants | Taiwan | 99.4 /100 | #47 | Exceptional 4.8% |
| Immigrants | Scotland | 99.3 /100 | #48 | Exceptional 4.9% |
| Immigrants | South Central Asia | 99.3 /100 | #49 | Exceptional 4.9% |
| French Canadians | 99.3 /100 | #50 | Exceptional 4.9% |
| Immigrants | Belgium | 99.2 /100 | #51 | Exceptional 4.9% |
| Whites/Caucasians | 99.2 /100 | #52 | Exceptional 4.9% |