Arab vs French Unemployment Among Seniors over 65 years
COMPARE
Arab
French
Unemployment Among Seniors over 65 years
Unemployment Among Seniors over 65 years Comparison
Arabs
French
5.1%
UNEMPLOYMENT AMONG SENIORS OVER 65 YEARS
84.3/ 100
METRIC RATING
137th/ 347
METRIC RANK
5.1%
UNEMPLOYMENT AMONG SENIORS OVER 65 YEARS
68.1/ 100
METRIC RATING
160th/ 347
METRIC RANK
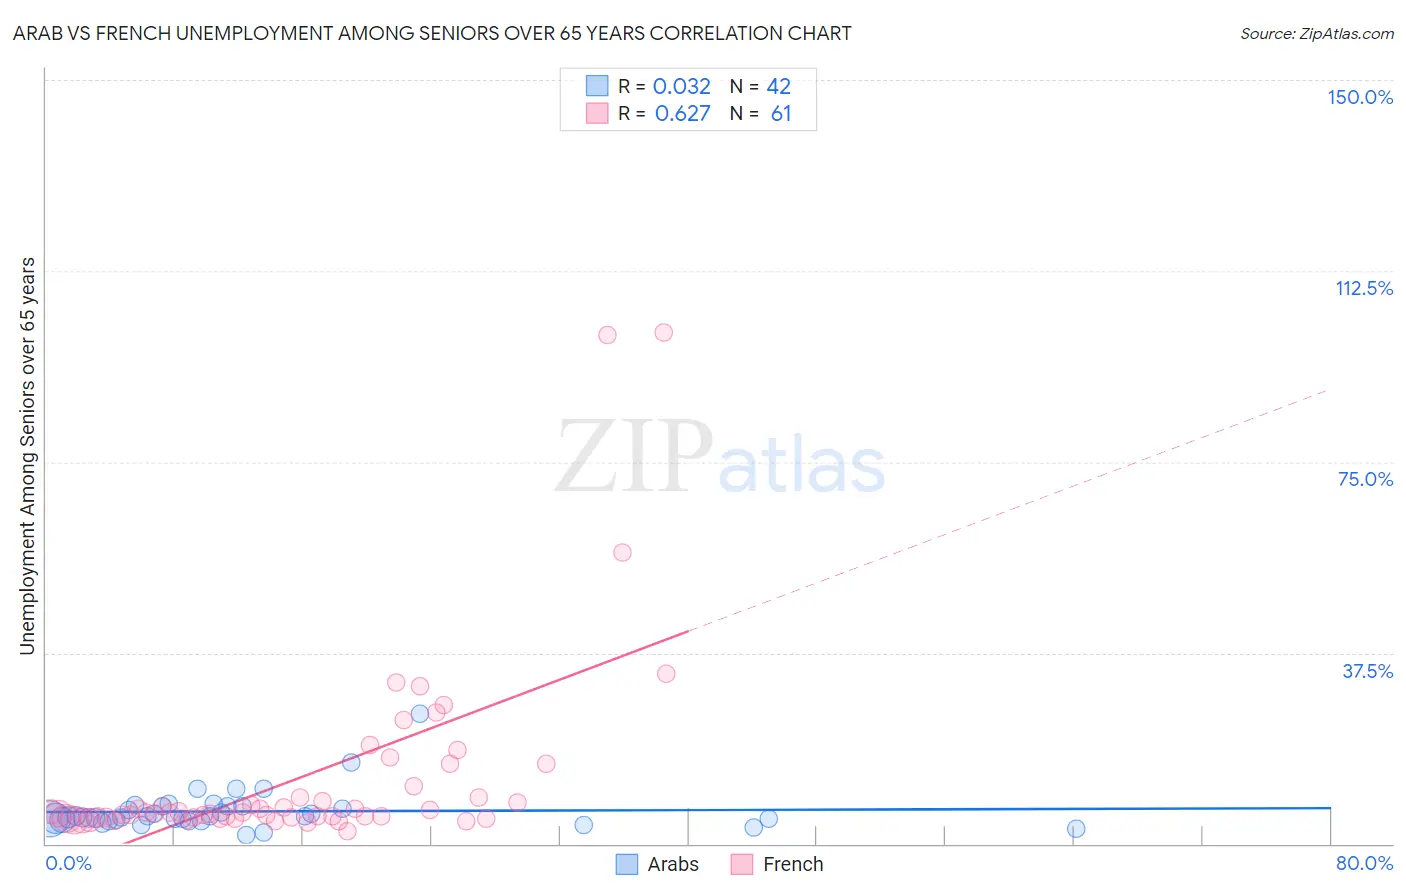
Arab vs French Unemployment Among Seniors over 65 years Correlation Chart
The statistical analysis conducted on geographies consisting of 424,548,870 people shows no correlation between the proportion of Arabs and unemployment rate amomg seniors over the age of 65 in the United States with a correlation coefficient (R) of 0.032 and weighted average of 5.1%. Similarly, the statistical analysis conducted on geographies consisting of 461,949,032 people shows a significant positive correlation between the proportion of French and unemployment rate amomg seniors over the age of 65 in the United States with a correlation coefficient (R) of 0.627 and weighted average of 5.1%, a difference of 0.75%.
Unemployment Among Seniors over 65 years Correlation Summary
| Measurement | Arab | French |
| Minimum | 1.6% | 2.5% |
| Maximum | 25.5% | 100.3% |
| Range | 23.9% | 97.8% |
| Mean | 6.3% | 13.0% |
| Median | 5.2% | 6.1% |
| Interquartile 25% (IQ1) | 4.7% | 5.1% |
| Interquartile 75% (IQ3) | 7.3% | 10.1% |
| Interquartile Range (IQR) | 2.6% | 5.1% |
| Standard Deviation (Sample) | 4.0% | 18.8% |
| Standard Deviation (Population) | 3.9% | 18.7% |
Similar Demographics by Unemployment Among Seniors over 65 years
Demographics Similar to Arabs by Unemployment Among Seniors over 65 years
In terms of unemployment among seniors over 65 years, the demographic groups most similar to Arabs are White/Caucasian (5.1%, a difference of 0.0%), Ukrainian (5.1%, a difference of 0.010%), Turkish (5.1%, a difference of 0.030%), Syrian (5.1%, a difference of 0.060%), and New Zealander (5.1%, a difference of 0.060%).
| Demographics | Rating | Rank | Unemployment Among Seniors over 65 years |
| Iranians | 86.6 /100 | #130 | Excellent 5.1% |
| Immigrants | Australia | 85.8 /100 | #131 | Excellent 5.1% |
| Chileans | 85.6 /100 | #132 | Excellent 5.1% |
| Syrians | 85.3 /100 | #133 | Excellent 5.1% |
| Turks | 84.9 /100 | #134 | Excellent 5.1% |
| Ukrainians | 84.4 /100 | #135 | Excellent 5.1% |
| Whites/Caucasians | 84.4 /100 | #136 | Excellent 5.1% |
| Arabs | 84.3 /100 | #137 | Excellent 5.1% |
| New Zealanders | 83.2 /100 | #138 | Excellent 5.1% |
| Immigrants | Panama | 83.0 /100 | #139 | Excellent 5.1% |
| Immigrants | Chile | 83.0 /100 | #140 | Excellent 5.1% |
| Cherokee | 81.6 /100 | #141 | Excellent 5.1% |
| Immigrants | Indonesia | 81.0 /100 | #142 | Excellent 5.1% |
| Senegalese | 80.4 /100 | #143 | Excellent 5.1% |
| Poles | 80.3 /100 | #144 | Excellent 5.1% |
Demographics Similar to French by Unemployment Among Seniors over 65 years
In terms of unemployment among seniors over 65 years, the demographic groups most similar to French are Immigrants from France (5.1%, a difference of 0.020%), Immigrants from Belarus (5.1%, a difference of 0.030%), Immigrants from Northern Europe (5.1%, a difference of 0.070%), Immigrants from Bosnia and Herzegovina (5.1%, a difference of 0.070%), and Immigrants from South Eastern Asia (5.1%, a difference of 0.090%).
| Demographics | Rating | Rank | Unemployment Among Seniors over 65 years |
| Immigrants | Czechoslovakia | 74.5 /100 | #153 | Good 5.1% |
| Immigrants | Hong Kong | 74.0 /100 | #154 | Good 5.1% |
| Basques | 72.9 /100 | #155 | Good 5.1% |
| Immigrants | Romania | 72.4 /100 | #156 | Good 5.1% |
| Immigrants | Northern Europe | 69.8 /100 | #157 | Good 5.1% |
| Immigrants | Belarus | 69.0 /100 | #158 | Good 5.1% |
| Immigrants | France | 68.6 /100 | #159 | Good 5.1% |
| French | 68.1 /100 | #160 | Good 5.1% |
| Immigrants | Bosnia and Herzegovina | 66.1 /100 | #161 | Good 5.1% |
| Immigrants | South Eastern Asia | 65.6 /100 | #162 | Good 5.1% |
| Potawatomi | 64.5 /100 | #163 | Good 5.1% |
| Nepalese | 64.5 /100 | #164 | Good 5.1% |
| Immigrants | Ukraine | 64.2 /100 | #165 | Good 5.1% |
| Immigrants | Laos | 63.8 /100 | #166 | Good 5.1% |
| Immigrants | Western Europe | 60.4 /100 | #167 | Good 5.1% |