Russian vs Nigerian Male Unemployment
COMPARE
Russian
Nigerian
Male Unemployment
Male Unemployment Comparison
Russians
Nigerians
5.1%
MALE UNEMPLOYMENT
92.9/ 100
METRIC RATING
100th/ 347
METRIC RANK
5.9%
MALE UNEMPLOYMENT
0.0/ 100
METRIC RATING
267th/ 347
METRIC RANK
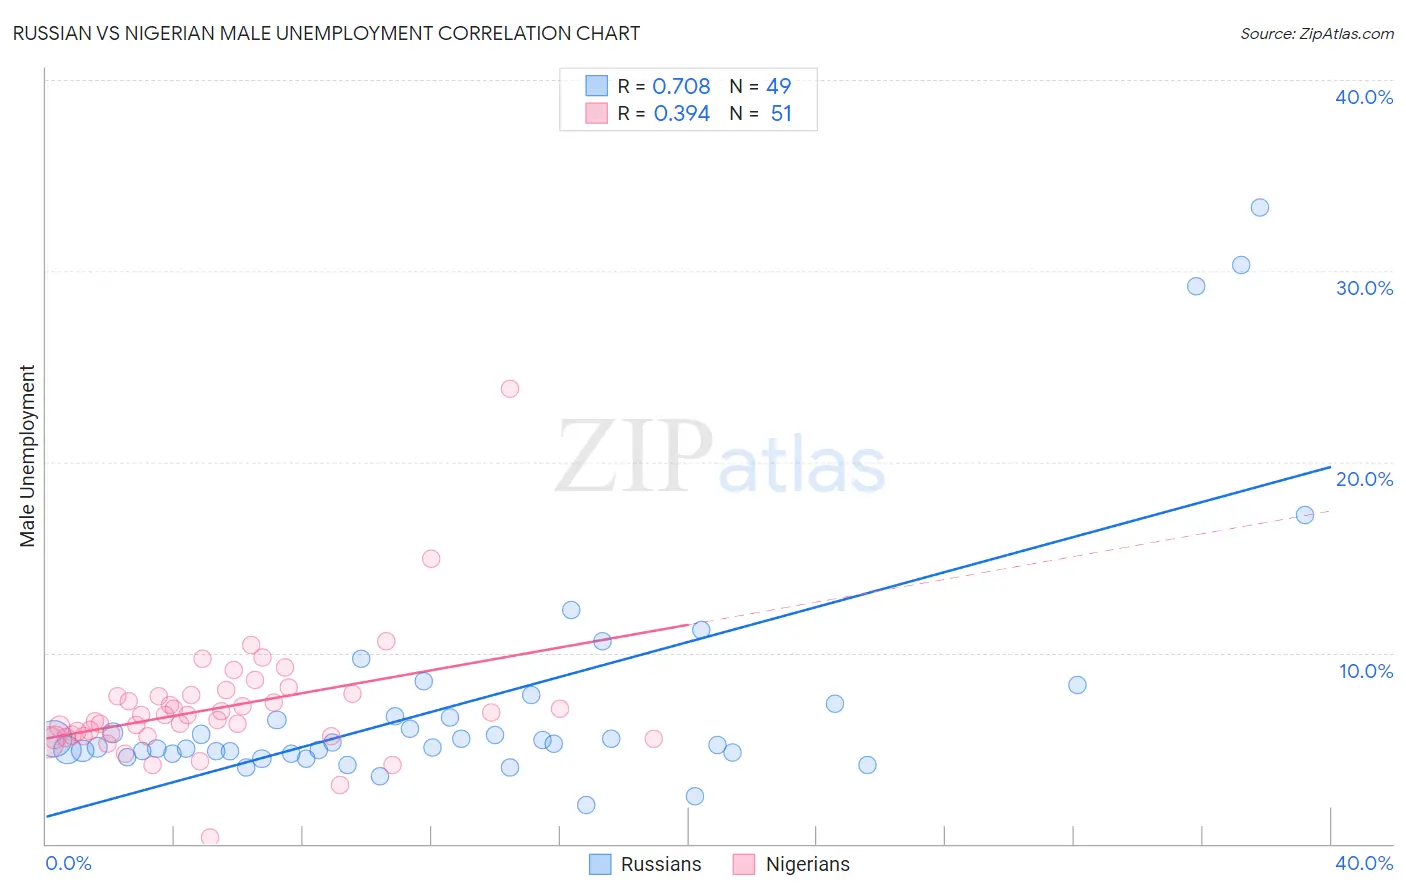
Russian vs Nigerian Male Unemployment Correlation Chart
The statistical analysis conducted on geographies consisting of 506,887,579 people shows a strong positive correlation between the proportion of Russians and unemployment rate among males in the United States with a correlation coefficient (R) of 0.708 and weighted average of 5.1%. Similarly, the statistical analysis conducted on geographies consisting of 332,030,597 people shows a mild positive correlation between the proportion of Nigerians and unemployment rate among males in the United States with a correlation coefficient (R) of 0.394 and weighted average of 5.9%, a difference of 16.3%.
Male Unemployment Correlation Summary
| Measurement | Russian | Nigerian |
| Minimum | 2.0% | 0.30% |
| Maximum | 33.3% | 23.8% |
| Range | 31.3% | 23.5% |
| Mean | 7.5% | 7.1% |
| Median | 5.2% | 6.7% |
| Interquartile 25% (IQ1) | 4.8% | 5.7% |
| Interquartile 75% (IQ3) | 7.0% | 7.8% |
| Interquartile Range (IQR) | 2.2% | 2.2% |
| Standard Deviation (Sample) | 6.6% | 3.2% |
| Standard Deviation (Population) | 6.5% | 3.2% |
Similar Demographics by Male Unemployment
Demographics Similar to Russians by Male Unemployment
In terms of male unemployment, the demographic groups most similar to Russians are Uruguayan (5.1%, a difference of 0.020%), German Russian (5.1%, a difference of 0.040%), Immigrants from France (5.1%, a difference of 0.060%), Immigrants from Kuwait (5.1%, a difference of 0.080%), and Immigrants from Spain (5.1%, a difference of 0.12%).
| Demographics | Rating | Rank | Male Unemployment |
| Immigrants | Serbia | 94.2 /100 | #93 | Exceptional 5.1% |
| Canadians | 94.1 /100 | #94 | Exceptional 5.1% |
| Italians | 93.8 /100 | #95 | Exceptional 5.1% |
| Asians | 93.7 /100 | #96 | Exceptional 5.1% |
| Immigrants | Spain | 93.4 /100 | #97 | Exceptional 5.1% |
| Immigrants | Kuwait | 93.3 /100 | #98 | Exceptional 5.1% |
| Uruguayans | 93.0 /100 | #99 | Exceptional 5.1% |
| Russians | 92.9 /100 | #100 | Exceptional 5.1% |
| German Russians | 92.7 /100 | #101 | Exceptional 5.1% |
| Immigrants | France | 92.7 /100 | #102 | Exceptional 5.1% |
| Immigrants | Jordan | 91.9 /100 | #103 | Exceptional 5.1% |
| Immigrants | Chile | 91.8 /100 | #104 | Exceptional 5.1% |
| Immigrants | Czechoslovakia | 91.7 /100 | #105 | Exceptional 5.1% |
| Immigrants | Ethiopia | 91.5 /100 | #106 | Exceptional 5.1% |
| Ethiopians | 91.3 /100 | #107 | Exceptional 5.1% |
Demographics Similar to Nigerians by Male Unemployment
In terms of male unemployment, the demographic groups most similar to Nigerians are Bahamian (5.9%, a difference of 0.12%), Bermudan (5.9%, a difference of 0.21%), French American Indian (5.9%, a difference of 0.26%), Immigrants from Nigeria (6.0%, a difference of 0.48%), and Subsaharan African (6.0%, a difference of 0.61%).
| Demographics | Rating | Rank | Male Unemployment |
| Immigrants | Central America | 0.1 /100 | #260 | Tragic 5.8% |
| Liberians | 0.1 /100 | #261 | Tragic 5.8% |
| Immigrants | Portugal | 0.1 /100 | #262 | Tragic 5.9% |
| Immigrants | Latin America | 0.1 /100 | #263 | Tragic 5.9% |
| Immigrants | Mexico | 0.0 /100 | #264 | Tragic 5.9% |
| French American Indians | 0.0 /100 | #265 | Tragic 5.9% |
| Bahamians | 0.0 /100 | #266 | Tragic 5.9% |
| Nigerians | 0.0 /100 | #267 | Tragic 5.9% |
| Bermudans | 0.0 /100 | #268 | Tragic 5.9% |
| Immigrants | Nigeria | 0.0 /100 | #269 | Tragic 6.0% |
| Sub-Saharan Africans | 0.0 /100 | #270 | Tragic 6.0% |
| Blackfeet | 0.0 /100 | #271 | Tragic 6.0% |
| Immigrants | Uzbekistan | 0.0 /100 | #272 | Tragic 6.0% |
| Armenians | 0.0 /100 | #273 | Tragic 6.0% |
| Immigrants | Sierra Leone | 0.0 /100 | #274 | Tragic 6.0% |