Immigrants from Jamaica vs Immigrants from Senegal Male Unemployment
COMPARE
Immigrants from Jamaica
Immigrants from Senegal
Male Unemployment
Male Unemployment Comparison
Immigrants from Jamaica
Immigrants from Senegal
6.7%
MALE UNEMPLOYMENT
0.0/ 100
METRIC RATING
307th/ 347
METRIC RANK
6.3%
MALE UNEMPLOYMENT
0.0/ 100
METRIC RATING
288th/ 347
METRIC RANK
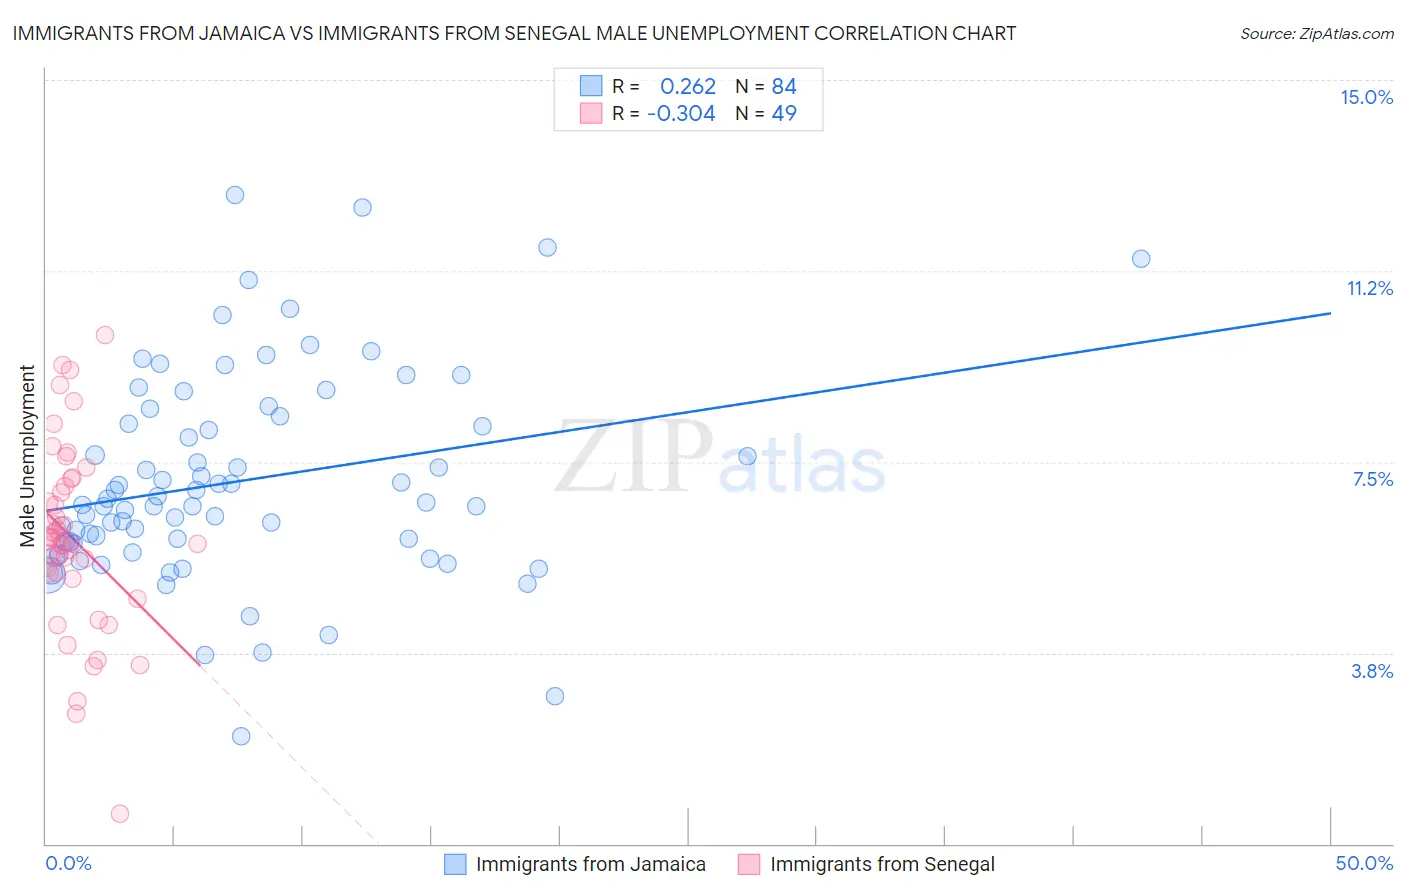
Immigrants from Jamaica vs Immigrants from Senegal Male Unemployment Correlation Chart
The statistical analysis conducted on geographies consisting of 300,907,129 people shows a weak positive correlation between the proportion of Immigrants from Jamaica and unemployment rate among males in the United States with a correlation coefficient (R) of 0.262 and weighted average of 6.7%. Similarly, the statistical analysis conducted on geographies consisting of 90,058,002 people shows a mild negative correlation between the proportion of Immigrants from Senegal and unemployment rate among males in the United States with a correlation coefficient (R) of -0.304 and weighted average of 6.3%, a difference of 6.8%.
Male Unemployment Correlation Summary
| Measurement | Immigrants from Jamaica | Immigrants from Senegal |
| Minimum | 2.1% | 0.60% |
| Maximum | 12.7% | 10.0% |
| Range | 10.6% | 9.4% |
| Mean | 7.1% | 6.0% |
| Median | 6.7% | 6.0% |
| Interquartile 25% (IQ1) | 5.9% | 5.3% |
| Interquartile 75% (IQ3) | 8.3% | 7.1% |
| Interquartile Range (IQR) | 2.4% | 1.8% |
| Standard Deviation (Sample) | 2.0% | 1.8% |
| Standard Deviation (Population) | 2.0% | 1.8% |
Demographics Similar to Immigrants from Jamaica and Immigrants from Senegal by Male Unemployment
In terms of male unemployment, the demographic groups most similar to Immigrants from Jamaica are Immigrants from Trinidad and Tobago (6.7%, a difference of 0.080%), Trinidadian and Tobagonian (6.7%, a difference of 0.28%), Immigrants from West Indies (6.7%, a difference of 0.60%), West Indian (6.7%, a difference of 0.60%), and Ute (6.6%, a difference of 0.97%). Similarly, the demographic groups most similar to Immigrants from Senegal are Central American Indian (6.3%, a difference of 0.040%), Immigrants from Caribbean (6.3%, a difference of 0.12%), U.S. Virgin Islander (6.4%, a difference of 1.7%), Immigrants from the Azores (6.4%, a difference of 2.2%), and Nepalese (6.4%, a difference of 2.6%).
| Demographics | Rating | Rank | Male Unemployment |
| Central American Indians | 0.0 /100 | #287 | Tragic 6.3% |
| Immigrants | Senegal | 0.0 /100 | #288 | Tragic 6.3% |
| Immigrants | Caribbean | 0.0 /100 | #289 | Tragic 6.3% |
| U.S. Virgin Islanders | 0.0 /100 | #290 | Tragic 6.4% |
| Immigrants | Azores | 0.0 /100 | #291 | Tragic 6.4% |
| Nepalese | 0.0 /100 | #292 | Tragic 6.4% |
| Haitians | 0.0 /100 | #293 | Tragic 6.4% |
| Senegalese | 0.0 /100 | #294 | Tragic 6.4% |
| Belizeans | 0.0 /100 | #295 | Tragic 6.5% |
| Immigrants | Haiti | 0.0 /100 | #296 | Tragic 6.5% |
| Chippewa | 0.0 /100 | #297 | Tragic 6.6% |
| Jamaicans | 0.0 /100 | #298 | Tragic 6.6% |
| Immigrants | Bangladesh | 0.0 /100 | #299 | Tragic 6.6% |
| Vietnamese | 0.0 /100 | #300 | Tragic 6.6% |
| Immigrants | Belize | 0.0 /100 | #301 | Tragic 6.6% |
| Ute | 0.0 /100 | #302 | Tragic 6.6% |
| Immigrants | West Indies | 0.0 /100 | #303 | Tragic 6.7% |
| West Indians | 0.0 /100 | #304 | Tragic 6.7% |
| Trinidadians and Tobagonians | 0.0 /100 | #305 | Tragic 6.7% |
| Immigrants | Trinidad and Tobago | 0.0 /100 | #306 | Tragic 6.7% |
| Immigrants | Jamaica | 0.0 /100 | #307 | Tragic 6.7% |