Spanish vs Immigrants from Kazakhstan Male Unemployment
COMPARE
Spanish
Immigrants from Kazakhstan
Male Unemployment
Male Unemployment Comparison
Spanish
Immigrants from Kazakhstan
5.4%
MALE UNEMPLOYMENT
19.7/ 100
METRIC RATING
194th/ 347
METRIC RANK
5.3%
MALE UNEMPLOYMENT
50.8/ 100
METRIC RATING
172nd/ 347
METRIC RANK
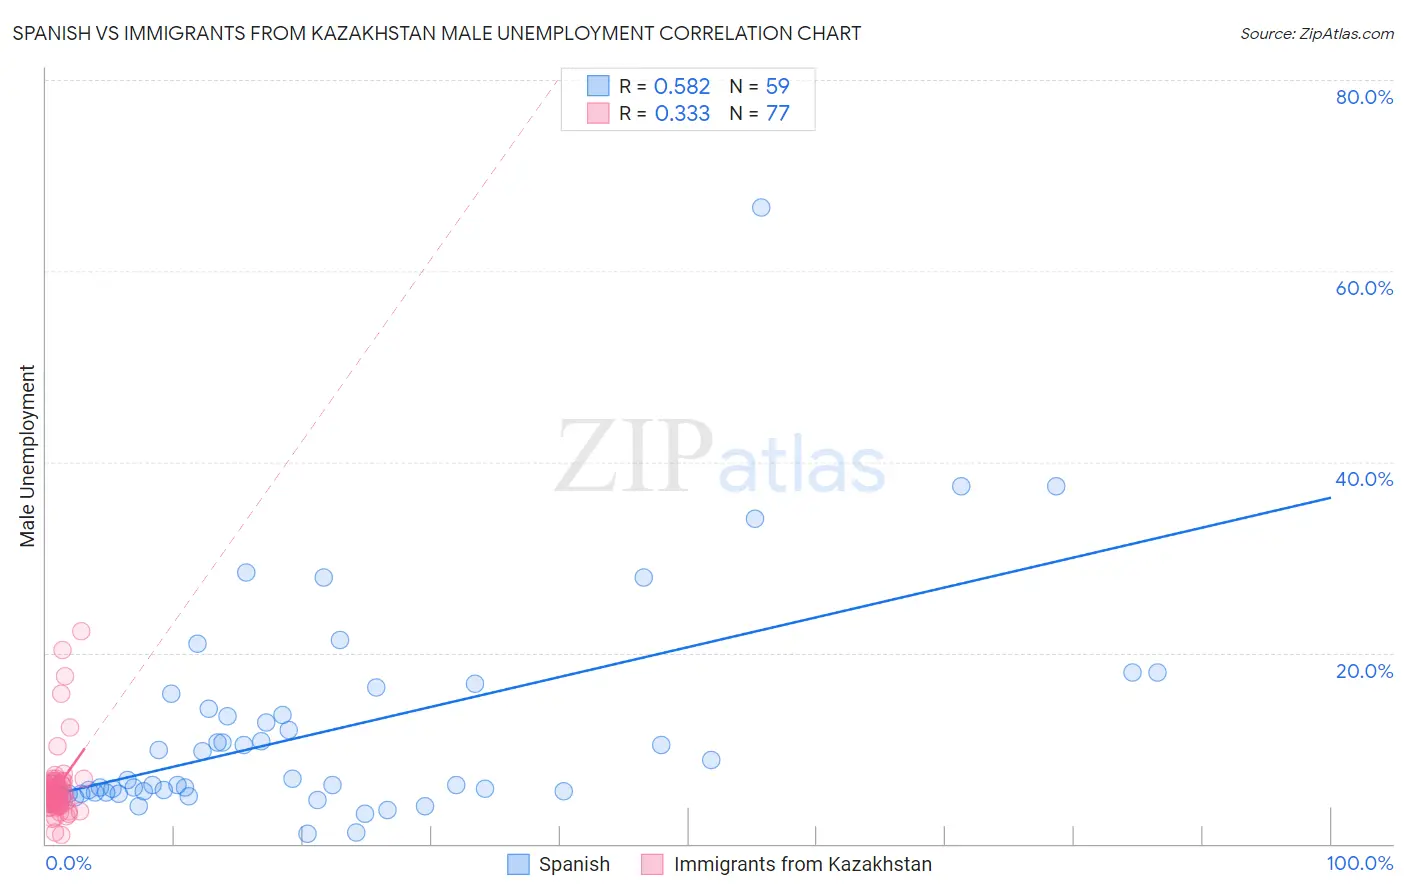
Spanish vs Immigrants from Kazakhstan Male Unemployment Correlation Chart
The statistical analysis conducted on geographies consisting of 419,777,027 people shows a substantial positive correlation between the proportion of Spanish and unemployment rate among males in the United States with a correlation coefficient (R) of 0.582 and weighted average of 5.4%. Similarly, the statistical analysis conducted on geographies consisting of 124,296,316 people shows a mild positive correlation between the proportion of Immigrants from Kazakhstan and unemployment rate among males in the United States with a correlation coefficient (R) of 0.333 and weighted average of 5.3%, a difference of 2.1%.
Male Unemployment Correlation Summary
| Measurement | Spanish | Immigrants from Kazakhstan |
| Minimum | 1.1% | 0.90% |
| Maximum | 66.7% | 22.3% |
| Range | 65.6% | 21.4% |
| Mean | 11.8% | 5.8% |
| Median | 6.2% | 5.1% |
| Interquartile 25% (IQ1) | 5.3% | 4.4% |
| Interquartile 75% (IQ3) | 14.1% | 6.2% |
| Interquartile Range (IQR) | 8.8% | 1.8% |
| Standard Deviation (Sample) | 11.4% | 3.5% |
| Standard Deviation (Population) | 11.3% | 3.5% |
Similar Demographics by Male Unemployment
Demographics Similar to Spanish by Male Unemployment
In terms of male unemployment, the demographic groups most similar to Spanish are Immigrants from Southern Europe (5.4%, a difference of 0.18%), Albanian (5.4%, a difference of 0.22%), Alsatian (5.4%, a difference of 0.28%), Immigrants from Israel (5.4%, a difference of 0.46%), and Immigrants from Thailand (5.4%, a difference of 0.50%).
| Demographics | Rating | Rank | Male Unemployment |
| Costa Ricans | 31.3 /100 | #187 | Fair 5.4% |
| Arabs | 30.2 /100 | #188 | Fair 5.4% |
| Immigrants | South America | 29.4 /100 | #189 | Fair 5.4% |
| Immigrants | Uganda | 28.8 /100 | #190 | Fair 5.4% |
| Immigrants | South Eastern Asia | 28.2 /100 | #191 | Fair 5.4% |
| Immigrants | Belarus | 26.0 /100 | #192 | Fair 5.4% |
| Immigrants | Israel | 25.2 /100 | #193 | Fair 5.4% |
| Spanish | 19.7 /100 | #194 | Poor 5.4% |
| Immigrants | Southern Europe | 17.7 /100 | #195 | Poor 5.4% |
| Albanians | 17.3 /100 | #196 | Poor 5.4% |
| Alsatians | 16.7 /100 | #197 | Poor 5.4% |
| Immigrants | Thailand | 14.7 /100 | #198 | Poor 5.4% |
| Immigrants | Greece | 14.5 /100 | #199 | Poor 5.4% |
| Immigrants | Zaire | 13.7 /100 | #200 | Poor 5.4% |
| Immigrants | Philippines | 13.5 /100 | #201 | Poor 5.4% |
Demographics Similar to Immigrants from Kazakhstan by Male Unemployment
In terms of male unemployment, the demographic groups most similar to Immigrants from Kazakhstan are Immigrants from Russia (5.3%, a difference of 0.010%), Immigrants from Iran (5.3%, a difference of 0.050%), Peruvian (5.3%, a difference of 0.060%), Immigrants from Iraq (5.3%, a difference of 0.16%), and Immigrants from Eastern Europe (5.3%, a difference of 0.19%).
| Demographics | Rating | Rank | Male Unemployment |
| South Americans | 60.6 /100 | #165 | Good 5.3% |
| Immigrants | Morocco | 60.2 /100 | #166 | Good 5.3% |
| Immigrants | Vietnam | 58.1 /100 | #167 | Average 5.3% |
| Immigrants | Ireland | 57.7 /100 | #168 | Average 5.3% |
| Immigrants | Congo | 57.4 /100 | #169 | Average 5.3% |
| Immigrants | Eastern Europe | 54.1 /100 | #170 | Average 5.3% |
| Peruvians | 51.9 /100 | #171 | Average 5.3% |
| Immigrants | Kazakhstan | 50.8 /100 | #172 | Average 5.3% |
| Immigrants | Russia | 50.7 /100 | #173 | Average 5.3% |
| Immigrants | Iran | 50.0 /100 | #174 | Average 5.3% |
| Immigrants | Iraq | 48.1 /100 | #175 | Average 5.3% |
| Immigrants | Poland | 46.0 /100 | #176 | Average 5.3% |
| Immigrants | Peru | 44.6 /100 | #177 | Average 5.3% |
| Osage | 42.5 /100 | #178 | Average 5.3% |
| Immigrants | Oceania | 40.8 /100 | #179 | Average 5.3% |