Albanian vs Immigrants from Belarus Male Unemployment
COMPARE
Albanian
Immigrants from Belarus
Male Unemployment
Male Unemployment Comparison
Albanians
Immigrants from Belarus
5.4%
MALE UNEMPLOYMENT
17.3/ 100
METRIC RATING
196th/ 347
METRIC RANK
5.4%
MALE UNEMPLOYMENT
26.0/ 100
METRIC RATING
192nd/ 347
METRIC RANK
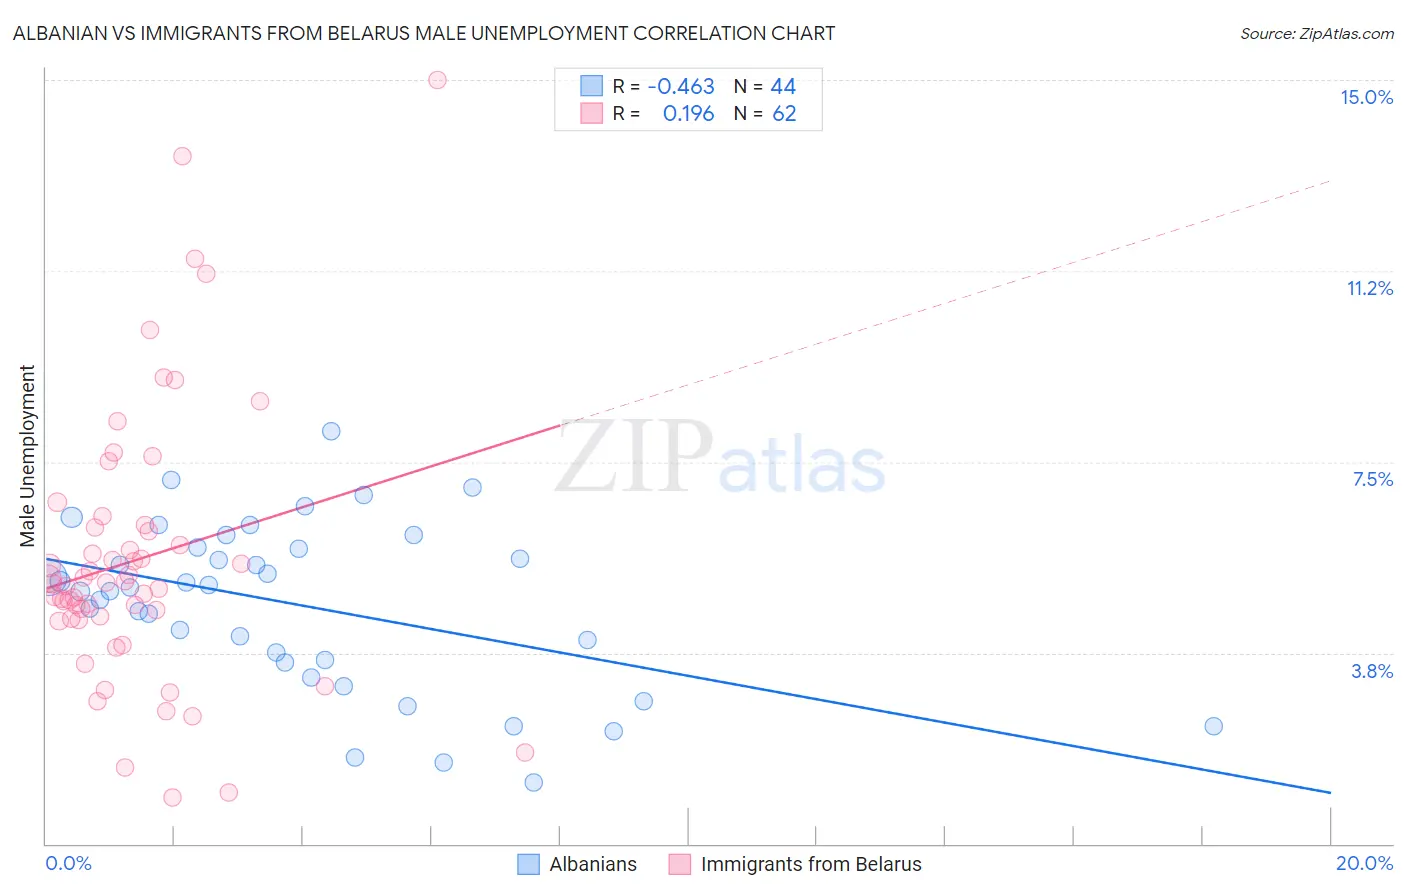
Albanian vs Immigrants from Belarus Male Unemployment Correlation Chart
The statistical analysis conducted on geographies consisting of 192,976,044 people shows a moderate negative correlation between the proportion of Albanians and unemployment rate among males in the United States with a correlation coefficient (R) of -0.463 and weighted average of 5.4%. Similarly, the statistical analysis conducted on geographies consisting of 150,060,028 people shows a poor positive correlation between the proportion of Immigrants from Belarus and unemployment rate among males in the United States with a correlation coefficient (R) of 0.196 and weighted average of 5.4%, a difference of 0.74%.
Male Unemployment Correlation Summary
| Measurement | Albanian | Immigrants from Belarus |
| Minimum | 1.2% | 0.90% |
| Maximum | 8.1% | 15.0% |
| Range | 6.9% | 14.1% |
| Mean | 4.7% | 5.6% |
| Median | 5.0% | 5.1% |
| Interquartile 25% (IQ1) | 3.6% | 4.4% |
| Interquartile 75% (IQ3) | 5.8% | 6.2% |
| Interquartile Range (IQR) | 2.2% | 1.8% |
| Standard Deviation (Sample) | 1.6% | 2.7% |
| Standard Deviation (Population) | 1.6% | 2.7% |
Demographics Similar to Albanians and Immigrants from Belarus by Male Unemployment
In terms of male unemployment, the demographic groups most similar to Albanians are Immigrants from Southern Europe (5.4%, a difference of 0.040%), Alsatian (5.4%, a difference of 0.060%), Spanish (5.4%, a difference of 0.22%), Immigrants from Thailand (5.4%, a difference of 0.28%), and Immigrants from Greece (5.4%, a difference of 0.30%). Similarly, the demographic groups most similar to Immigrants from Belarus are Immigrants from Israel (5.4%, a difference of 0.060%), Immigrants from South Eastern Asia (5.4%, a difference of 0.16%), Immigrants from Uganda (5.4%, a difference of 0.20%), Immigrants from South America (5.4%, a difference of 0.24%), and Arab (5.4%, a difference of 0.30%).
| Demographics | Rating | Rank | Male Unemployment |
| Spaniards | 35.1 /100 | #184 | Fair 5.3% |
| Koreans | 34.9 /100 | #185 | Fair 5.3% |
| Iraqis | 31.6 /100 | #186 | Fair 5.4% |
| Costa Ricans | 31.3 /100 | #187 | Fair 5.4% |
| Arabs | 30.2 /100 | #188 | Fair 5.4% |
| Immigrants | South America | 29.4 /100 | #189 | Fair 5.4% |
| Immigrants | Uganda | 28.8 /100 | #190 | Fair 5.4% |
| Immigrants | South Eastern Asia | 28.2 /100 | #191 | Fair 5.4% |
| Immigrants | Belarus | 26.0 /100 | #192 | Fair 5.4% |
| Immigrants | Israel | 25.2 /100 | #193 | Fair 5.4% |
| Spanish | 19.7 /100 | #194 | Poor 5.4% |
| Immigrants | Southern Europe | 17.7 /100 | #195 | Poor 5.4% |
| Albanians | 17.3 /100 | #196 | Poor 5.4% |
| Alsatians | 16.7 /100 | #197 | Poor 5.4% |
| Immigrants | Thailand | 14.7 /100 | #198 | Poor 5.4% |
| Immigrants | Greece | 14.5 /100 | #199 | Poor 5.4% |
| Immigrants | Zaire | 13.7 /100 | #200 | Poor 5.4% |
| Immigrants | Philippines | 13.5 /100 | #201 | Poor 5.4% |
| Immigrants | Nonimmigrants | 13.1 /100 | #202 | Poor 5.4% |
| Immigrants | Laos | 13.0 /100 | #203 | Poor 5.4% |
| Guamanians/Chamorros | 12.3 /100 | #204 | Poor 5.4% |