Albanian vs Asian Male Unemployment
COMPARE
Albanian
Asian
Male Unemployment
Male Unemployment Comparison
Albanians
Asians
5.4%
MALE UNEMPLOYMENT
17.3/ 100
METRIC RATING
196th/ 347
METRIC RANK
5.1%
MALE UNEMPLOYMENT
93.7/ 100
METRIC RATING
96th/ 347
METRIC RANK
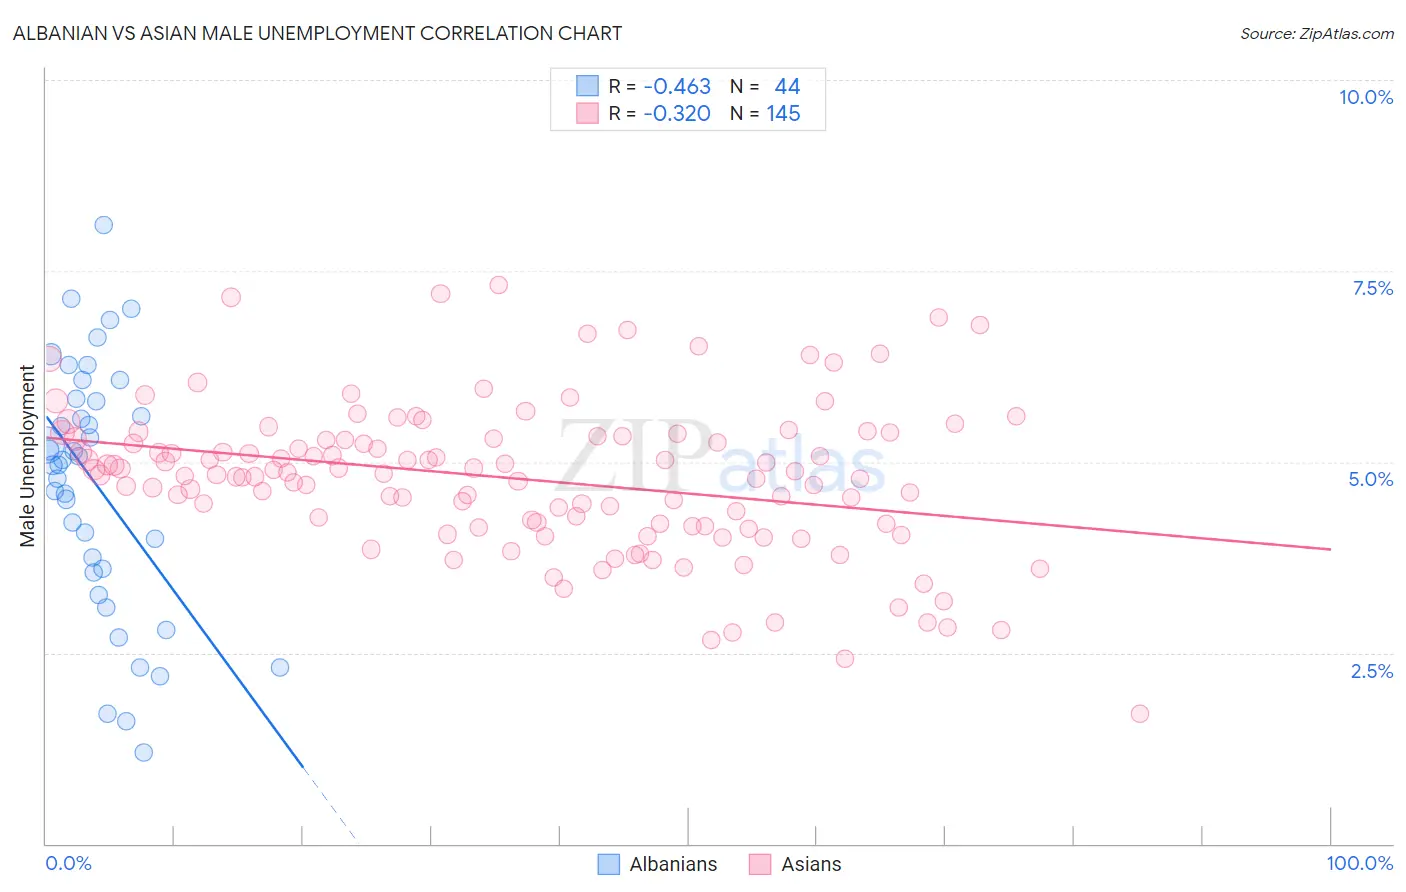
Albanian vs Asian Male Unemployment Correlation Chart
The statistical analysis conducted on geographies consisting of 192,976,044 people shows a moderate negative correlation between the proportion of Albanians and unemployment rate among males in the United States with a correlation coefficient (R) of -0.463 and weighted average of 5.4%. Similarly, the statistical analysis conducted on geographies consisting of 543,892,334 people shows a mild negative correlation between the proportion of Asians and unemployment rate among males in the United States with a correlation coefficient (R) of -0.320 and weighted average of 5.1%, a difference of 6.5%.
Male Unemployment Correlation Summary
| Measurement | Albanian | Asian |
| Minimum | 1.2% | 1.7% |
| Maximum | 8.1% | 7.3% |
| Range | 6.9% | 5.6% |
| Mean | 4.7% | 4.8% |
| Median | 5.0% | 4.8% |
| Interquartile 25% (IQ1) | 3.6% | 4.2% |
| Interquartile 75% (IQ3) | 5.8% | 5.3% |
| Interquartile Range (IQR) | 2.2% | 1.1% |
| Standard Deviation (Sample) | 1.6% | 0.98% |
| Standard Deviation (Population) | 1.6% | 0.98% |
Similar Demographics by Male Unemployment
Demographics Similar to Albanians by Male Unemployment
In terms of male unemployment, the demographic groups most similar to Albanians are Immigrants from Southern Europe (5.4%, a difference of 0.040%), Alsatian (5.4%, a difference of 0.060%), Spanish (5.4%, a difference of 0.22%), Immigrants from Thailand (5.4%, a difference of 0.28%), and Immigrants from Greece (5.4%, a difference of 0.30%).
| Demographics | Rating | Rank | Male Unemployment |
| Immigrants | South America | 29.4 /100 | #189 | Fair 5.4% |
| Immigrants | Uganda | 28.8 /100 | #190 | Fair 5.4% |
| Immigrants | South Eastern Asia | 28.2 /100 | #191 | Fair 5.4% |
| Immigrants | Belarus | 26.0 /100 | #192 | Fair 5.4% |
| Immigrants | Israel | 25.2 /100 | #193 | Fair 5.4% |
| Spanish | 19.7 /100 | #194 | Poor 5.4% |
| Immigrants | Southern Europe | 17.7 /100 | #195 | Poor 5.4% |
| Albanians | 17.3 /100 | #196 | Poor 5.4% |
| Alsatians | 16.7 /100 | #197 | Poor 5.4% |
| Immigrants | Thailand | 14.7 /100 | #198 | Poor 5.4% |
| Immigrants | Greece | 14.5 /100 | #199 | Poor 5.4% |
| Immigrants | Zaire | 13.7 /100 | #200 | Poor 5.4% |
| Immigrants | Philippines | 13.5 /100 | #201 | Poor 5.4% |
| Immigrants | Nonimmigrants | 13.1 /100 | #202 | Poor 5.4% |
| Immigrants | Laos | 13.0 /100 | #203 | Poor 5.4% |
Demographics Similar to Asians by Male Unemployment
In terms of male unemployment, the demographic groups most similar to Asians are Italian (5.1%, a difference of 0.030%), Immigrants from Spain (5.1%, a difference of 0.070%), Canadian (5.1%, a difference of 0.10%), Immigrants from Kuwait (5.1%, a difference of 0.11%), and Slavic (5.1%, a difference of 0.15%).
| Demographics | Rating | Rank | Male Unemployment |
| Immigrants | Australia | 94.7 /100 | #89 | Exceptional 5.1% |
| Okinawans | 94.7 /100 | #90 | Exceptional 5.1% |
| Immigrants | Turkey | 94.4 /100 | #91 | Exceptional 5.1% |
| Slavs | 94.2 /100 | #92 | Exceptional 5.1% |
| Immigrants | Serbia | 94.2 /100 | #93 | Exceptional 5.1% |
| Canadians | 94.1 /100 | #94 | Exceptional 5.1% |
| Italians | 93.8 /100 | #95 | Exceptional 5.1% |
| Asians | 93.7 /100 | #96 | Exceptional 5.1% |
| Immigrants | Spain | 93.4 /100 | #97 | Exceptional 5.1% |
| Immigrants | Kuwait | 93.3 /100 | #98 | Exceptional 5.1% |
| Uruguayans | 93.0 /100 | #99 | Exceptional 5.1% |
| Russians | 92.9 /100 | #100 | Exceptional 5.1% |
| German Russians | 92.7 /100 | #101 | Exceptional 5.1% |
| Immigrants | France | 92.7 /100 | #102 | Exceptional 5.1% |
| Immigrants | Jordan | 91.9 /100 | #103 | Exceptional 5.1% |