Albanian vs Immigrants from Lithuania Male Unemployment
COMPARE
Albanian
Immigrants from Lithuania
Male Unemployment
Male Unemployment Comparison
Albanians
Immigrants from Lithuania
5.4%
MALE UNEMPLOYMENT
17.3/ 100
METRIC RATING
196th/ 347
METRIC RANK
5.1%
MALE UNEMPLOYMENT
87.2/ 100
METRIC RATING
125th/ 347
METRIC RANK
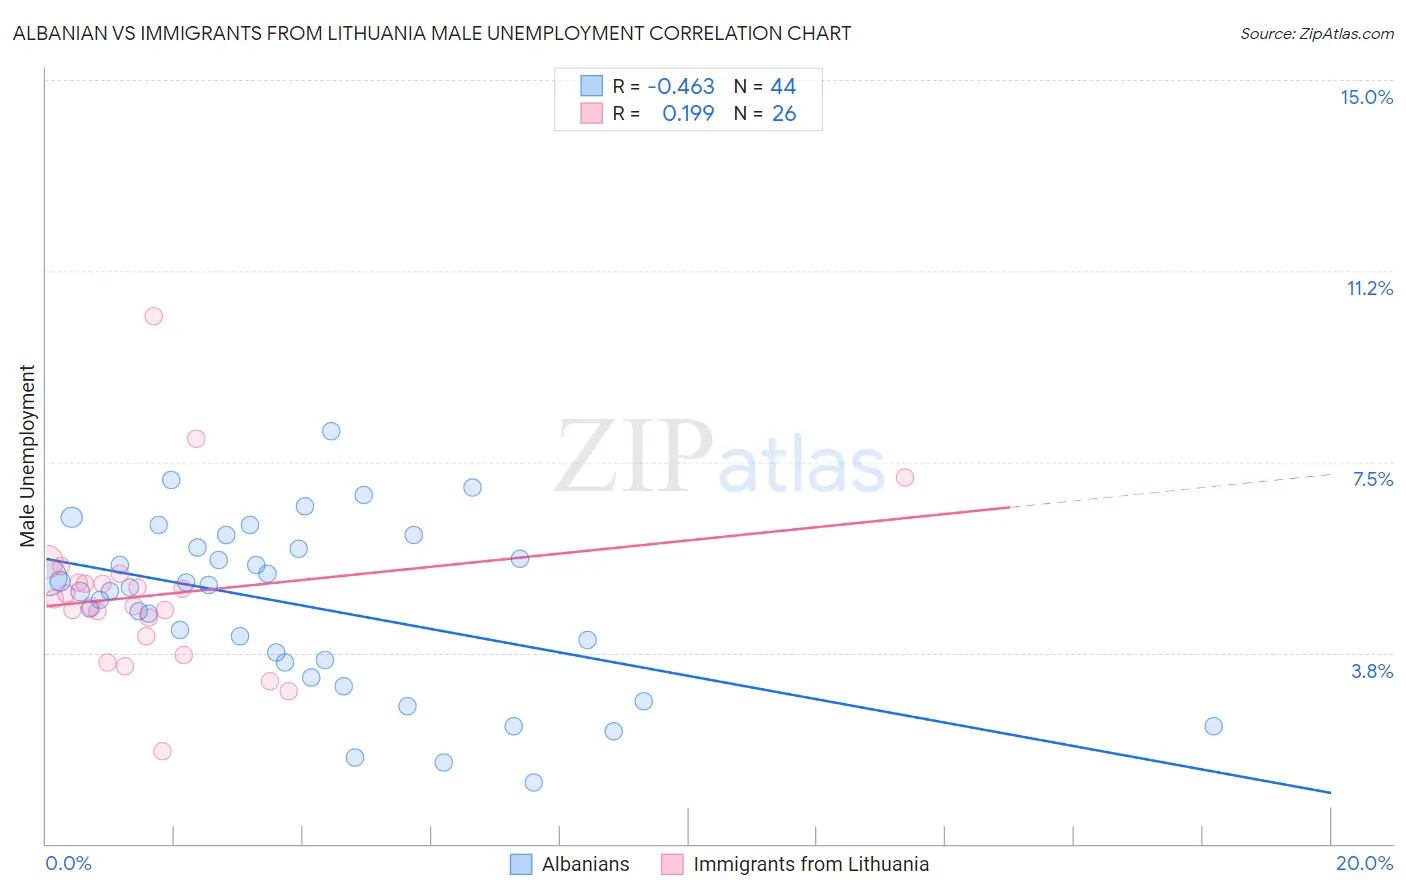
Albanian vs Immigrants from Lithuania Male Unemployment Correlation Chart
The statistical analysis conducted on geographies consisting of 192,976,044 people shows a moderate negative correlation between the proportion of Albanians and unemployment rate among males in the United States with a correlation coefficient (R) of -0.463 and weighted average of 5.4%. Similarly, the statistical analysis conducted on geographies consisting of 117,611,759 people shows a poor positive correlation between the proportion of Immigrants from Lithuania and unemployment rate among males in the United States with a correlation coefficient (R) of 0.199 and weighted average of 5.1%, a difference of 5.2%.
Male Unemployment Correlation Summary
| Measurement | Albanian | Immigrants from Lithuania |
| Minimum | 1.2% | 1.8% |
| Maximum | 8.1% | 10.4% |
| Range | 6.9% | 8.5% |
| Mean | 4.7% | 4.9% |
| Median | 5.0% | 4.7% |
| Interquartile 25% (IQ1) | 3.6% | 4.1% |
| Interquartile 75% (IQ3) | 5.8% | 5.1% |
| Interquartile Range (IQR) | 2.2% | 1.1% |
| Standard Deviation (Sample) | 1.6% | 1.6% |
| Standard Deviation (Population) | 1.6% | 1.6% |
Similar Demographics by Male Unemployment
Demographics Similar to Albanians by Male Unemployment
In terms of male unemployment, the demographic groups most similar to Albanians are Immigrants from Southern Europe (5.4%, a difference of 0.040%), Alsatian (5.4%, a difference of 0.060%), Spanish (5.4%, a difference of 0.22%), Immigrants from Thailand (5.4%, a difference of 0.28%), and Immigrants from Greece (5.4%, a difference of 0.30%).
| Demographics | Rating | Rank | Male Unemployment |
| Immigrants | South America | 29.4 /100 | #189 | Fair 5.4% |
| Immigrants | Uganda | 28.8 /100 | #190 | Fair 5.4% |
| Immigrants | South Eastern Asia | 28.2 /100 | #191 | Fair 5.4% |
| Immigrants | Belarus | 26.0 /100 | #192 | Fair 5.4% |
| Immigrants | Israel | 25.2 /100 | #193 | Fair 5.4% |
| Spanish | 19.7 /100 | #194 | Poor 5.4% |
| Immigrants | Southern Europe | 17.7 /100 | #195 | Poor 5.4% |
| Albanians | 17.3 /100 | #196 | Poor 5.4% |
| Alsatians | 16.7 /100 | #197 | Poor 5.4% |
| Immigrants | Thailand | 14.7 /100 | #198 | Poor 5.4% |
| Immigrants | Greece | 14.5 /100 | #199 | Poor 5.4% |
| Immigrants | Zaire | 13.7 /100 | #200 | Poor 5.4% |
| Immigrants | Philippines | 13.5 /100 | #201 | Poor 5.4% |
| Immigrants | Nonimmigrants | 13.1 /100 | #202 | Poor 5.4% |
| Immigrants | Laos | 13.0 /100 | #203 | Poor 5.4% |
Demographics Similar to Immigrants from Lithuania by Male Unemployment
In terms of male unemployment, the demographic groups most similar to Immigrants from Lithuania are Immigrants from Latvia (5.1%, a difference of 0.040%), Immigrants from Colombia (5.1%, a difference of 0.060%), Palestinian (5.1%, a difference of 0.070%), Immigrants from Brazil (5.2%, a difference of 0.11%), and Nicaraguan (5.1%, a difference of 0.14%).
| Demographics | Rating | Rank | Male Unemployment |
| Cypriots | 88.8 /100 | #118 | Excellent 5.1% |
| French Canadians | 88.6 /100 | #119 | Excellent 5.1% |
| Ukrainians | 88.4 /100 | #120 | Excellent 5.1% |
| Mongolians | 88.4 /100 | #121 | Excellent 5.1% |
| Nicaraguans | 88.2 /100 | #122 | Excellent 5.1% |
| Palestinians | 87.7 /100 | #123 | Excellent 5.1% |
| Immigrants | Latvia | 87.5 /100 | #124 | Excellent 5.1% |
| Immigrants | Lithuania | 87.2 /100 | #125 | Excellent 5.1% |
| Immigrants | Colombia | 86.8 /100 | #126 | Excellent 5.1% |
| Immigrants | Brazil | 86.3 /100 | #127 | Excellent 5.2% |
| Hungarians | 85.1 /100 | #128 | Excellent 5.2% |
| Immigrants | Western Europe | 84.8 /100 | #129 | Excellent 5.2% |
| Immigrants | Malaysia | 83.5 /100 | #130 | Excellent 5.2% |
| Immigrants | Germany | 83.0 /100 | #131 | Excellent 5.2% |
| Chickasaw | 82.9 /100 | #132 | Excellent 5.2% |