Alaskan Athabascan vs Immigrants from Serbia Female Unemployment
COMPARE
Alaskan Athabascan
Immigrants from Serbia
Female Unemployment
Female Unemployment Comparison
Alaskan Athabascans
Immigrants from Serbia
6.1%
FEMALE UNEMPLOYMENT
0.0/ 100
METRIC RATING
296th/ 347
METRIC RANK
5.0%
FEMALE UNEMPLOYMENT
97.2/ 100
METRIC RATING
83rd/ 347
METRIC RANK
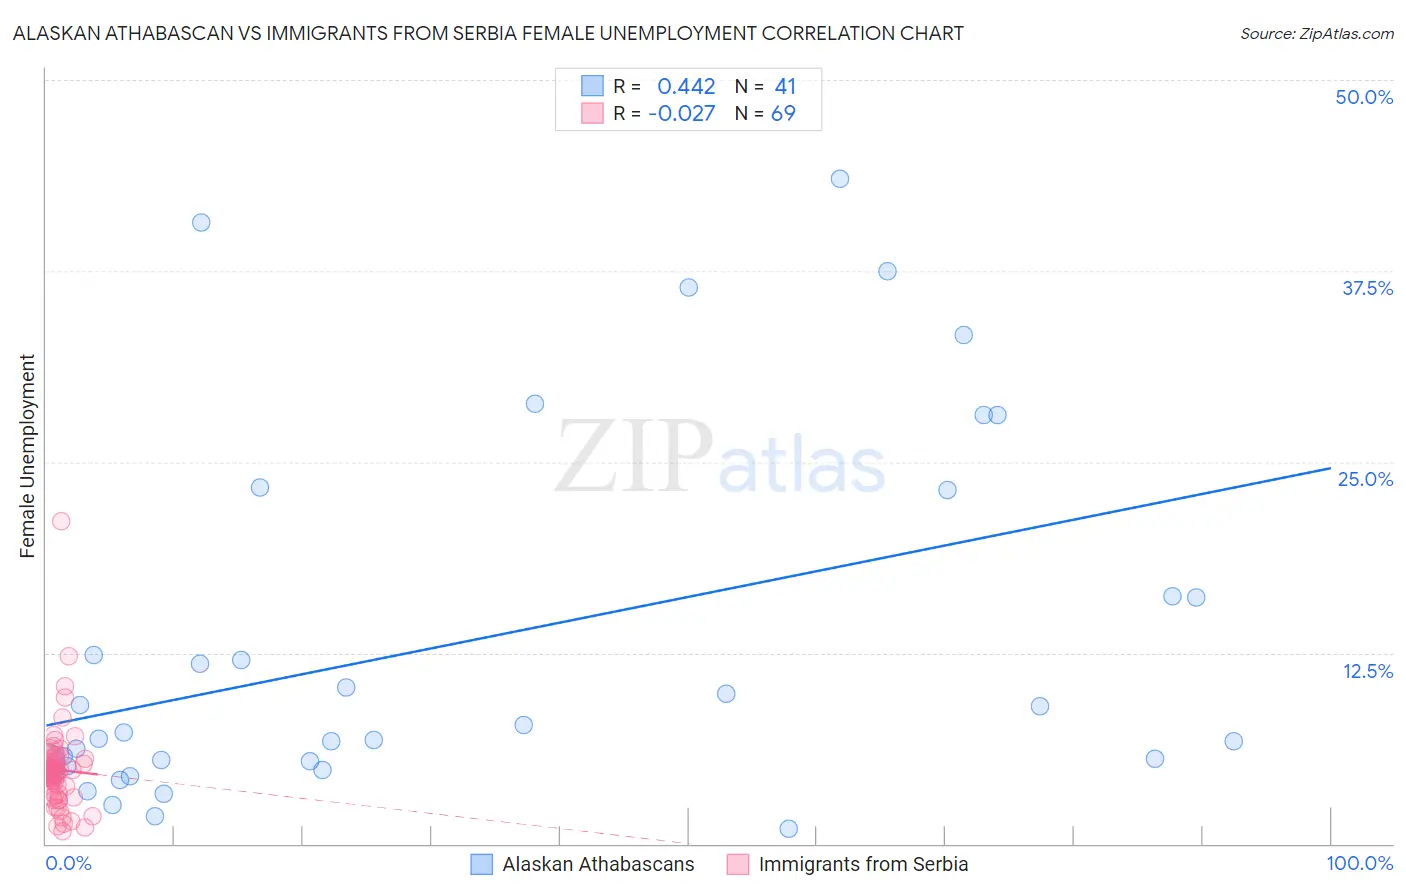
Alaskan Athabascan vs Immigrants from Serbia Female Unemployment Correlation Chart
The statistical analysis conducted on geographies consisting of 45,741,943 people shows a moderate positive correlation between the proportion of Alaskan Athabascans and unemploymnet rate among females in the United States with a correlation coefficient (R) of 0.442 and weighted average of 6.1%. Similarly, the statistical analysis conducted on geographies consisting of 131,575,347 people shows no correlation between the proportion of Immigrants from Serbia and unemploymnet rate among females in the United States with a correlation coefficient (R) of -0.027 and weighted average of 5.0%, a difference of 23.0%.
Female Unemployment Correlation Summary
| Measurement | Alaskan Athabascan | Immigrants from Serbia |
| Minimum | 1.0% | 0.80% |
| Maximum | 43.5% | 21.1% |
| Range | 42.5% | 20.3% |
| Mean | 13.2% | 4.8% |
| Median | 7.3% | 4.7% |
| Interquartile 25% (IQ1) | 5.2% | 3.4% |
| Interquartile 75% (IQ3) | 19.7% | 5.4% |
| Interquartile Range (IQR) | 14.4% | 1.9% |
| Standard Deviation (Sample) | 11.9% | 2.8% |
| Standard Deviation (Population) | 11.8% | 2.8% |
Similar Demographics by Female Unemployment
Demographics Similar to Alaskan Athabascans by Female Unemployment
In terms of female unemployment, the demographic groups most similar to Alaskan Athabascans are West Indian (6.1%, a difference of 0.010%), Immigrants from Latin America (6.1%, a difference of 0.020%), Jamaican (6.1%, a difference of 0.030%), Immigrants from El Salvador (6.1%, a difference of 0.12%), and Ute (6.1%, a difference of 0.13%).
| Demographics | Rating | Rank | Female Unemployment |
| Trinidadians and Tobagonians | 0.0 /100 | #289 | Tragic 6.1% |
| Immigrants | Caribbean | 0.0 /100 | #290 | Tragic 6.1% |
| Immigrants | West Indies | 0.0 /100 | #291 | Tragic 6.1% |
| Immigrants | Trinidad and Tobago | 0.0 /100 | #292 | Tragic 6.1% |
| Mexicans | 0.0 /100 | #293 | Tragic 6.1% |
| Immigrants | El Salvador | 0.0 /100 | #294 | Tragic 6.1% |
| Immigrants | Latin America | 0.0 /100 | #295 | Tragic 6.1% |
| Alaskan Athabascans | 0.0 /100 | #296 | Tragic 6.1% |
| West Indians | 0.0 /100 | #297 | Tragic 6.1% |
| Jamaicans | 0.0 /100 | #298 | Tragic 6.1% |
| Ute | 0.0 /100 | #299 | Tragic 6.1% |
| Immigrants | Haiti | 0.0 /100 | #300 | Tragic 6.1% |
| Immigrants | Barbados | 0.0 /100 | #301 | Tragic 6.2% |
| U.S. Virgin Islanders | 0.0 /100 | #302 | Tragic 6.2% |
| Barbadians | 0.0 /100 | #303 | Tragic 6.2% |
Demographics Similar to Immigrants from Serbia by Female Unemployment
In terms of female unemployment, the demographic groups most similar to Immigrants from Serbia are Immigrants from Australia (5.0%, a difference of 0.020%), Canadian (5.0%, a difference of 0.040%), Filipino (5.0%, a difference of 0.070%), Ukrainian (5.0%, a difference of 0.080%), and New Zealander (5.0%, a difference of 0.090%).
| Demographics | Rating | Rank | Female Unemployment |
| Immigrants | Venezuela | 97.9 /100 | #76 | Exceptional 5.0% |
| Mongolians | 97.8 /100 | #77 | Exceptional 5.0% |
| Immigrants | Netherlands | 97.8 /100 | #78 | Exceptional 5.0% |
| Turks | 97.6 /100 | #79 | Exceptional 5.0% |
| New Zealanders | 97.4 /100 | #80 | Exceptional 5.0% |
| Filipinos | 97.3 /100 | #81 | Exceptional 5.0% |
| Immigrants | Australia | 97.3 /100 | #82 | Exceptional 5.0% |
| Immigrants | Serbia | 97.2 /100 | #83 | Exceptional 5.0% |
| Canadians | 97.2 /100 | #84 | Exceptional 5.0% |
| Ukrainians | 97.1 /100 | #85 | Exceptional 5.0% |
| Bolivians | 97.1 /100 | #86 | Exceptional 5.0% |
| Venezuelans | 96.9 /100 | #87 | Exceptional 5.0% |
| Immigrants | Sudan | 96.7 /100 | #88 | Exceptional 5.0% |
| Immigrants | Taiwan | 96.6 /100 | #89 | Exceptional 5.0% |
| Immigrants | Sweden | 96.3 /100 | #90 | Exceptional 5.0% |