Alaskan Athabascan vs Immigrants from Egypt Female Unemployment
COMPARE
Alaskan Athabascan
Immigrants from Egypt
Female Unemployment
Female Unemployment Comparison
Alaskan Athabascans
Immigrants from Egypt
6.1%
FEMALE UNEMPLOYMENT
0.0/ 100
METRIC RATING
296th/ 347
METRIC RANK
5.2%
FEMALE UNEMPLOYMENT
70.0/ 100
METRIC RATING
155th/ 347
METRIC RANK
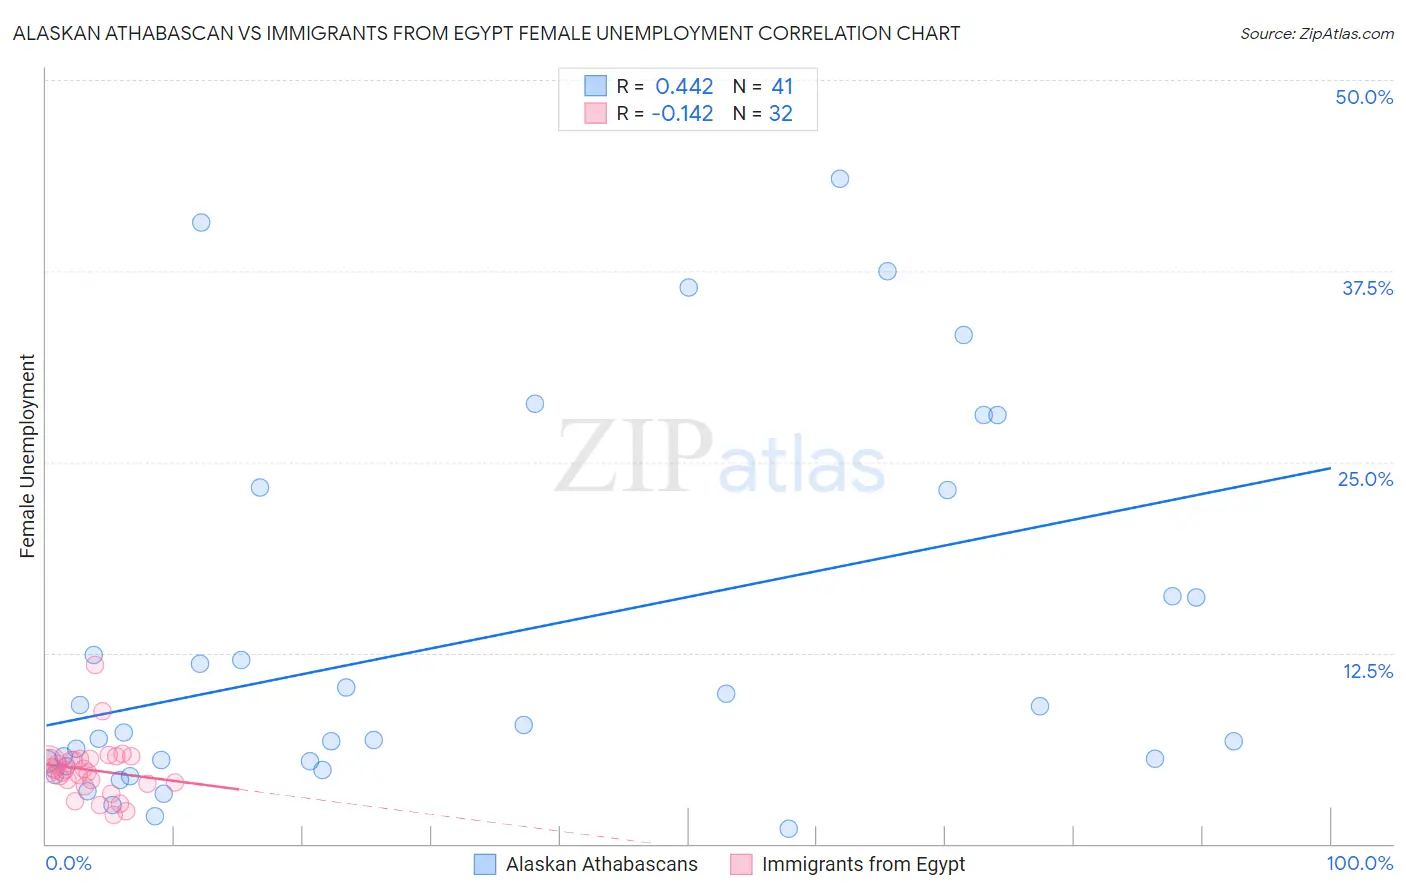
Alaskan Athabascan vs Immigrants from Egypt Female Unemployment Correlation Chart
The statistical analysis conducted on geographies consisting of 45,741,943 people shows a moderate positive correlation between the proportion of Alaskan Athabascans and unemploymnet rate among females in the United States with a correlation coefficient (R) of 0.442 and weighted average of 6.1%. Similarly, the statistical analysis conducted on geographies consisting of 245,194,116 people shows a poor negative correlation between the proportion of Immigrants from Egypt and unemploymnet rate among females in the United States with a correlation coefficient (R) of -0.142 and weighted average of 5.2%, a difference of 17.9%.
Female Unemployment Correlation Summary
| Measurement | Alaskan Athabascan | Immigrants from Egypt |
| Minimum | 1.0% | 1.9% |
| Maximum | 43.5% | 11.7% |
| Range | 42.5% | 9.8% |
| Mean | 13.2% | 4.8% |
| Median | 7.3% | 4.8% |
| Interquartile 25% (IQ1) | 5.2% | 4.0% |
| Interquartile 75% (IQ3) | 19.7% | 5.5% |
| Interquartile Range (IQR) | 14.4% | 1.6% |
| Standard Deviation (Sample) | 11.9% | 1.8% |
| Standard Deviation (Population) | 11.8% | 1.8% |
Similar Demographics by Female Unemployment
Demographics Similar to Alaskan Athabascans by Female Unemployment
In terms of female unemployment, the demographic groups most similar to Alaskan Athabascans are West Indian (6.1%, a difference of 0.010%), Immigrants from Latin America (6.1%, a difference of 0.020%), Jamaican (6.1%, a difference of 0.030%), Immigrants from El Salvador (6.1%, a difference of 0.12%), and Ute (6.1%, a difference of 0.13%).
| Demographics | Rating | Rank | Female Unemployment |
| Trinidadians and Tobagonians | 0.0 /100 | #289 | Tragic 6.1% |
| Immigrants | Caribbean | 0.0 /100 | #290 | Tragic 6.1% |
| Immigrants | West Indies | 0.0 /100 | #291 | Tragic 6.1% |
| Immigrants | Trinidad and Tobago | 0.0 /100 | #292 | Tragic 6.1% |
| Mexicans | 0.0 /100 | #293 | Tragic 6.1% |
| Immigrants | El Salvador | 0.0 /100 | #294 | Tragic 6.1% |
| Immigrants | Latin America | 0.0 /100 | #295 | Tragic 6.1% |
| Alaskan Athabascans | 0.0 /100 | #296 | Tragic 6.1% |
| West Indians | 0.0 /100 | #297 | Tragic 6.1% |
| Jamaicans | 0.0 /100 | #298 | Tragic 6.1% |
| Ute | 0.0 /100 | #299 | Tragic 6.1% |
| Immigrants | Haiti | 0.0 /100 | #300 | Tragic 6.1% |
| Immigrants | Barbados | 0.0 /100 | #301 | Tragic 6.2% |
| U.S. Virgin Islanders | 0.0 /100 | #302 | Tragic 6.2% |
| Barbadians | 0.0 /100 | #303 | Tragic 6.2% |
Demographics Similar to Immigrants from Egypt by Female Unemployment
In terms of female unemployment, the demographic groups most similar to Immigrants from Egypt are Immigrants from Northern Africa (5.2%, a difference of 0.030%), Immigrants from Russia (5.2%, a difference of 0.050%), South African (5.2%, a difference of 0.060%), Albanian (5.2%, a difference of 0.12%), and Immigrants from Micronesia (5.2%, a difference of 0.22%).
| Demographics | Rating | Rank | Female Unemployment |
| Immigrants | Argentina | 78.7 /100 | #148 | Good 5.2% |
| Asians | 78.3 /100 | #149 | Good 5.2% |
| Egyptians | 78.3 /100 | #150 | Good 5.2% |
| Immigrants | China | 75.9 /100 | #151 | Good 5.2% |
| Immigrants | Italy | 75.0 /100 | #152 | Good 5.2% |
| Immigrants | Greece | 74.9 /100 | #153 | Good 5.2% |
| South Africans | 70.8 /100 | #154 | Good 5.2% |
| Immigrants | Egypt | 70.0 /100 | #155 | Good 5.2% |
| Immigrants | Northern Africa | 69.6 /100 | #156 | Good 5.2% |
| Immigrants | Russia | 69.3 /100 | #157 | Good 5.2% |
| Albanians | 68.3 /100 | #158 | Good 5.2% |
| Immigrants | Micronesia | 66.9 /100 | #159 | Good 5.2% |
| Immigrants | Spain | 66.8 /100 | #160 | Good 5.2% |
| Immigrants | Pakistan | 66.7 /100 | #161 | Good 5.2% |
| Potawatomi | 65.9 /100 | #162 | Good 5.2% |