African vs Jamaican Female Unemployment
COMPARE
African
Jamaican
Female Unemployment
Female Unemployment Comparison
Africans
Jamaicans
5.9%
FEMALE UNEMPLOYMENT
0.0/ 100
METRIC RATING
274th/ 347
METRIC RANK
6.1%
FEMALE UNEMPLOYMENT
0.0/ 100
METRIC RATING
298th/ 347
METRIC RANK
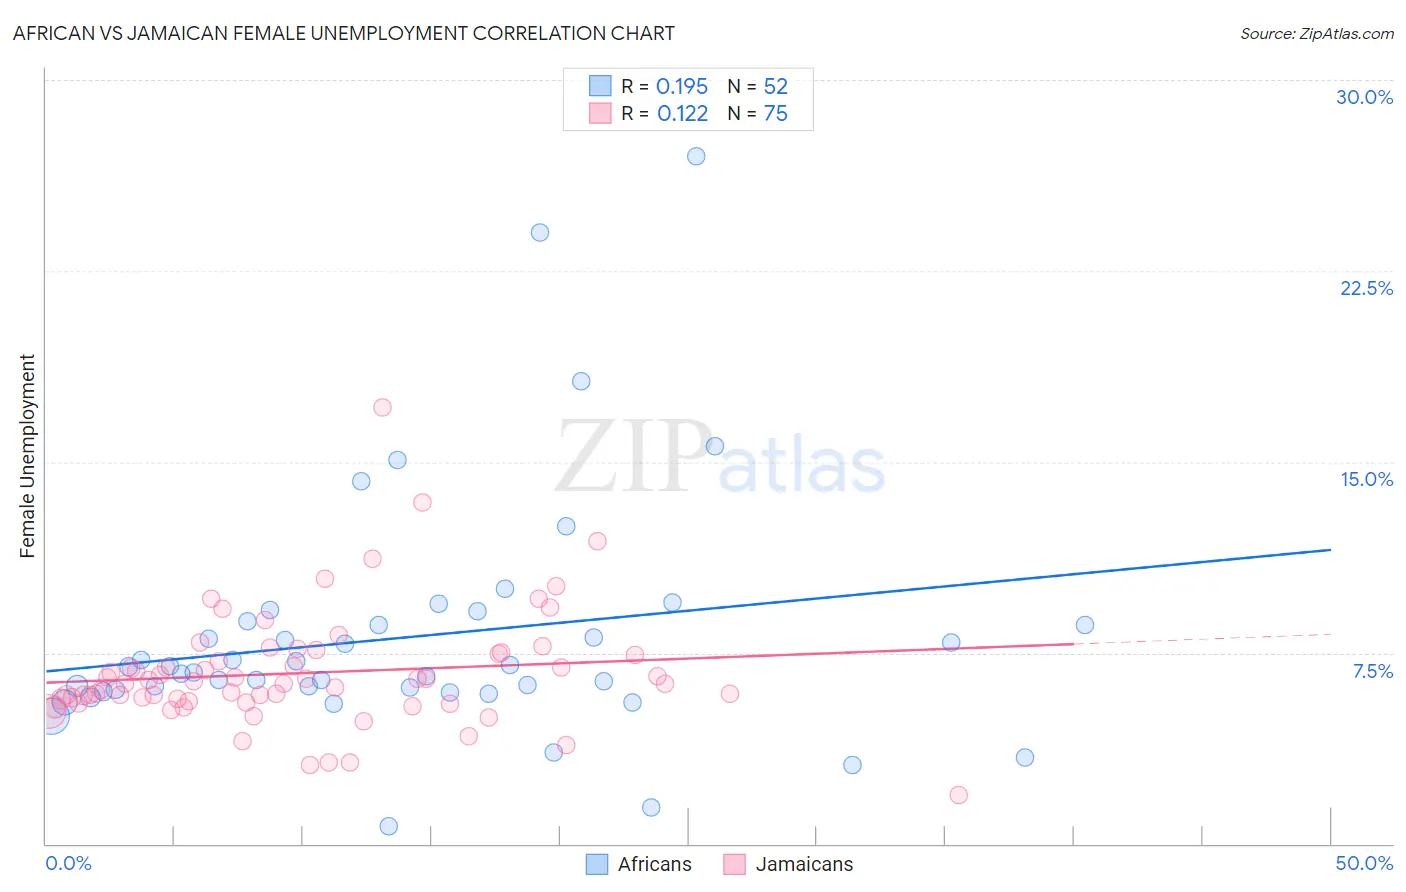
African vs Jamaican Female Unemployment Correlation Chart
The statistical analysis conducted on geographies consisting of 467,075,487 people shows a poor positive correlation between the proportion of Africans and unemploymnet rate among females in the United States with a correlation coefficient (R) of 0.195 and weighted average of 5.9%. Similarly, the statistical analysis conducted on geographies consisting of 366,799,566 people shows a poor positive correlation between the proportion of Jamaicans and unemploymnet rate among females in the United States with a correlation coefficient (R) of 0.122 and weighted average of 6.1%, a difference of 2.9%.
Female Unemployment Correlation Summary
| Measurement | African | Jamaican |
| Minimum | 0.68% | 1.9% |
| Maximum | 27.0% | 17.2% |
| Range | 26.3% | 15.3% |
| Mean | 8.1% | 6.7% |
| Median | 6.8% | 6.3% |
| Interquartile 25% (IQ1) | 6.0% | 5.6% |
| Interquartile 75% (IQ3) | 8.7% | 7.5% |
| Interquartile Range (IQR) | 2.7% | 1.9% |
| Standard Deviation (Sample) | 4.7% | 2.3% |
| Standard Deviation (Population) | 4.7% | 2.3% |
Similar Demographics by Female Unemployment
Demographics Similar to Africans by Female Unemployment
In terms of female unemployment, the demographic groups most similar to Africans are Ghanaian (5.9%, a difference of 0.080%), Lumbee (5.9%, a difference of 0.090%), Central American (5.9%, a difference of 0.28%), Immigrants from Honduras (5.9%, a difference of 0.38%), and Senegalese (6.0%, a difference of 0.49%).
| Demographics | Rating | Rank | Female Unemployment |
| Nepalese | 0.0 /100 | #267 | Tragic 5.9% |
| Hondurans | 0.0 /100 | #268 | Tragic 5.9% |
| Immigrants | Western Africa | 0.0 /100 | #269 | Tragic 5.9% |
| Immigrants | Honduras | 0.0 /100 | #270 | Tragic 5.9% |
| Central Americans | 0.0 /100 | #271 | Tragic 5.9% |
| Lumbee | 0.0 /100 | #272 | Tragic 5.9% |
| Ghanaians | 0.0 /100 | #273 | Tragic 5.9% |
| Africans | 0.0 /100 | #274 | Tragic 5.9% |
| Senegalese | 0.0 /100 | #275 | Tragic 6.0% |
| Bahamians | 0.0 /100 | #276 | Tragic 6.0% |
| Immigrants | Ghana | 0.0 /100 | #277 | Tragic 6.0% |
| Yaqui | 0.0 /100 | #278 | Tragic 6.0% |
| Armenians | 0.0 /100 | #279 | Tragic 6.0% |
| Mexican American Indians | 0.0 /100 | #280 | Tragic 6.0% |
| Guatemalans | 0.0 /100 | #281 | Tragic 6.0% |
Demographics Similar to Jamaicans by Female Unemployment
In terms of female unemployment, the demographic groups most similar to Jamaicans are West Indian (6.1%, a difference of 0.020%), Alaskan Athabascan (6.1%, a difference of 0.030%), Immigrants from Latin America (6.1%, a difference of 0.050%), Ute (6.1%, a difference of 0.10%), and Immigrants from Haiti (6.1%, a difference of 0.15%).
| Demographics | Rating | Rank | Female Unemployment |
| Immigrants | West Indies | 0.0 /100 | #291 | Tragic 6.1% |
| Immigrants | Trinidad and Tobago | 0.0 /100 | #292 | Tragic 6.1% |
| Mexicans | 0.0 /100 | #293 | Tragic 6.1% |
| Immigrants | El Salvador | 0.0 /100 | #294 | Tragic 6.1% |
| Immigrants | Latin America | 0.0 /100 | #295 | Tragic 6.1% |
| Alaskan Athabascans | 0.0 /100 | #296 | Tragic 6.1% |
| West Indians | 0.0 /100 | #297 | Tragic 6.1% |
| Jamaicans | 0.0 /100 | #298 | Tragic 6.1% |
| Ute | 0.0 /100 | #299 | Tragic 6.1% |
| Immigrants | Haiti | 0.0 /100 | #300 | Tragic 6.1% |
| Immigrants | Barbados | 0.0 /100 | #301 | Tragic 6.2% |
| U.S. Virgin Islanders | 0.0 /100 | #302 | Tragic 6.2% |
| Barbadians | 0.0 /100 | #303 | Tragic 6.2% |
| Immigrants | Jamaica | 0.0 /100 | #304 | Tragic 6.2% |
| Spanish American Indians | 0.0 /100 | #305 | Tragic 6.2% |