Immigrants from Barbados vs Immigrants from Burma/Myanmar Male Unemployment
COMPARE
Immigrants from Barbados
Immigrants from Burma/Myanmar
Male Unemployment
Male Unemployment Comparison
Immigrants from Barbados
Immigrants from Burma/Myanmar
7.1%
MALE UNEMPLOYMENT
0.0/ 100
METRIC RATING
314th/ 347
METRIC RANK
5.2%
MALE UNEMPLOYMENT
77.5/ 100
METRIC RATING
147th/ 347
METRIC RANK
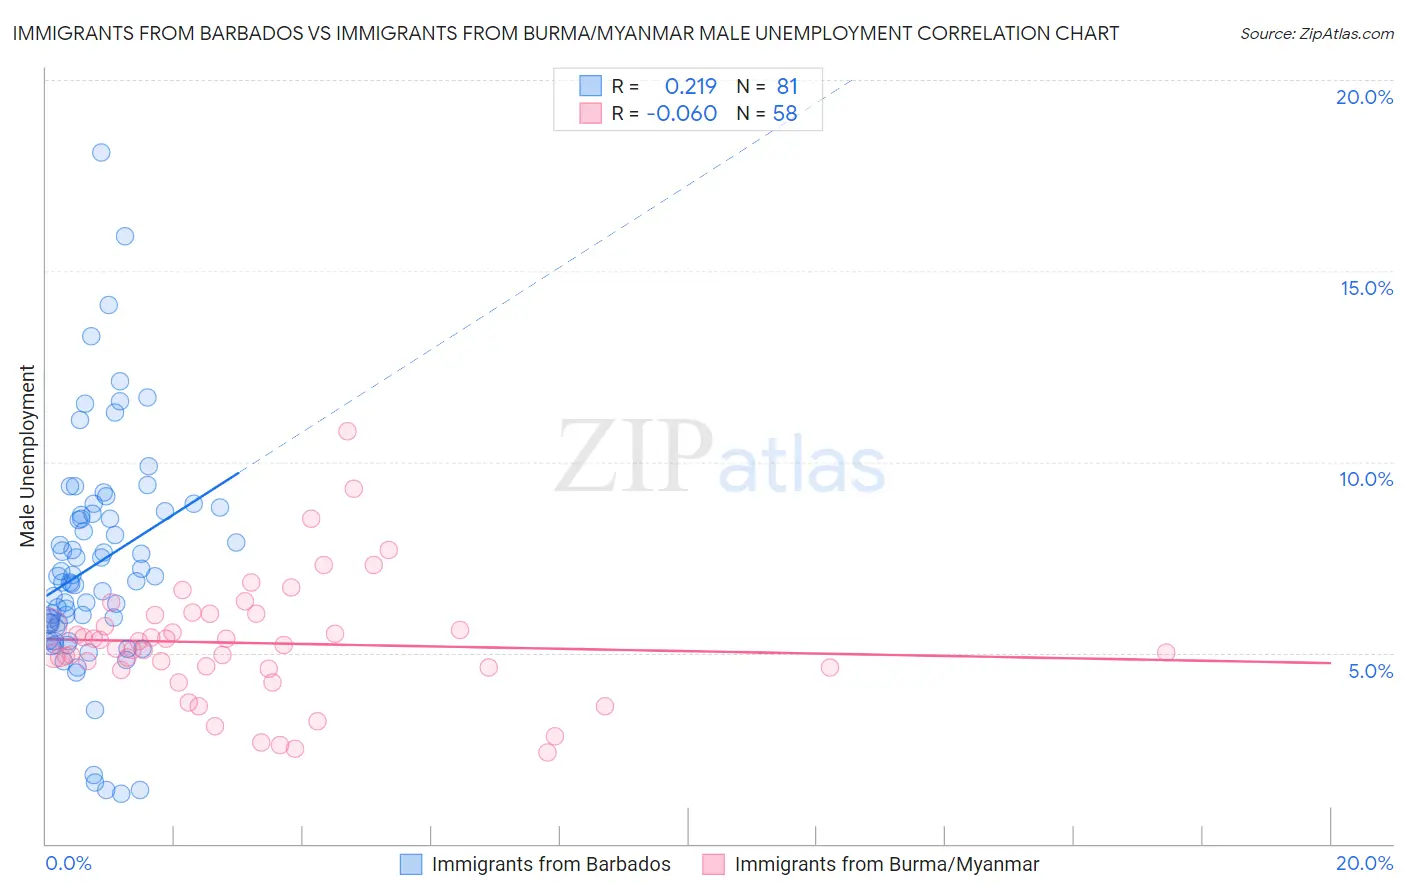
Immigrants from Barbados vs Immigrants from Burma/Myanmar Male Unemployment Correlation Chart
The statistical analysis conducted on geographies consisting of 112,710,362 people shows a weak positive correlation between the proportion of Immigrants from Barbados and unemployment rate among males in the United States with a correlation coefficient (R) of 0.219 and weighted average of 7.1%. Similarly, the statistical analysis conducted on geographies consisting of 172,208,828 people shows a slight negative correlation between the proportion of Immigrants from Burma/Myanmar and unemployment rate among males in the United States with a correlation coefficient (R) of -0.060 and weighted average of 5.2%, a difference of 36.4%.
Male Unemployment Correlation Summary
| Measurement | Immigrants from Barbados | Immigrants from Burma/Myanmar |
| Minimum | 1.3% | 2.4% |
| Maximum | 18.1% | 10.8% |
| Range | 16.8% | 8.4% |
| Mean | 7.3% | 5.3% |
| Median | 6.9% | 5.2% |
| Interquartile 25% (IQ1) | 5.7% | 4.6% |
| Interquartile 75% (IQ3) | 8.7% | 6.0% |
| Interquartile Range (IQR) | 3.0% | 1.4% |
| Standard Deviation (Sample) | 3.0% | 1.6% |
| Standard Deviation (Population) | 3.0% | 1.6% |
Similar Demographics by Male Unemployment
Demographics Similar to Immigrants from Barbados by Male Unemployment
In terms of male unemployment, the demographic groups most similar to Immigrants from Barbados are Houma (7.1%, a difference of 0.21%), Immigrants from Guyana (7.1%, a difference of 0.24%), Guyanese (7.1%, a difference of 0.30%), Cape Verdean (7.1%, a difference of 0.36%), and Immigrants from Dominica (7.0%, a difference of 1.3%).
| Demographics | Rating | Rank | Male Unemployment |
| Immigrants | Jamaica | 0.0 /100 | #307 | Tragic 6.7% |
| Aleuts | 0.0 /100 | #308 | Tragic 6.8% |
| Barbadians | 0.0 /100 | #309 | Tragic 6.9% |
| Blacks/African Americans | 0.0 /100 | #310 | Tragic 6.9% |
| Immigrants | Armenia | 0.0 /100 | #311 | Tragic 6.9% |
| Lumbee | 0.0 /100 | #312 | Tragic 6.9% |
| Immigrants | Dominica | 0.0 /100 | #313 | Tragic 7.0% |
| Immigrants | Barbados | 0.0 /100 | #314 | Tragic 7.1% |
| Houma | 0.0 /100 | #315 | Tragic 7.1% |
| Immigrants | Guyana | 0.0 /100 | #316 | Tragic 7.1% |
| Guyanese | 0.0 /100 | #317 | Tragic 7.1% |
| Cape Verdeans | 0.0 /100 | #318 | Tragic 7.1% |
| British West Indians | 0.0 /100 | #319 | Tragic 7.3% |
| Colville | 0.0 /100 | #320 | Tragic 7.4% |
| Immigrants | St. Vincent and the Grenadines | 0.0 /100 | #321 | Tragic 7.5% |
Demographics Similar to Immigrants from Burma/Myanmar by Male Unemployment
In terms of male unemployment, the demographic groups most similar to Immigrants from Burma/Myanmar are Immigrants from Kenya (5.2%, a difference of 0.010%), Macedonian (5.2%, a difference of 0.020%), Sri Lankan (5.2%, a difference of 0.030%), Syrian (5.2%, a difference of 0.040%), and Fijian (5.2%, a difference of 0.070%).
| Demographics | Rating | Rank | Male Unemployment |
| Brazilians | 79.3 /100 | #140 | Good 5.2% |
| Immigrants | Switzerland | 79.2 /100 | #141 | Good 5.2% |
| Fijians | 78.3 /100 | #142 | Good 5.2% |
| Syrians | 78.0 /100 | #143 | Good 5.2% |
| Sri Lankans | 77.9 /100 | #144 | Good 5.2% |
| Macedonians | 77.7 /100 | #145 | Good 5.2% |
| Immigrants | Kenya | 77.6 /100 | #146 | Good 5.2% |
| Immigrants | Burma/Myanmar | 77.5 /100 | #147 | Good 5.2% |
| Immigrants | Italy | 76.3 /100 | #148 | Good 5.2% |
| Immigrants | Europe | 76.2 /100 | #149 | Good 5.2% |
| Indians (Asian) | 76.0 /100 | #150 | Good 5.2% |
| Slovaks | 75.5 /100 | #151 | Good 5.2% |
| Egyptians | 74.8 /100 | #152 | Good 5.2% |
| Immigrants | Uruguay | 73.9 /100 | #153 | Good 5.2% |
| Laotians | 73.8 /100 | #154 | Good 5.2% |