Immigrants from South Africa vs Immigrants from Burma/Myanmar Male Unemployment
COMPARE
Immigrants from South Africa
Immigrants from Burma/Myanmar
Male Unemployment
Male Unemployment Comparison
Immigrants from South Africa
Immigrants from Burma/Myanmar
5.0%
MALE UNEMPLOYMENT
97.1/ 100
METRIC RATING
72nd/ 347
METRIC RANK
5.2%
MALE UNEMPLOYMENT
77.5/ 100
METRIC RATING
147th/ 347
METRIC RANK
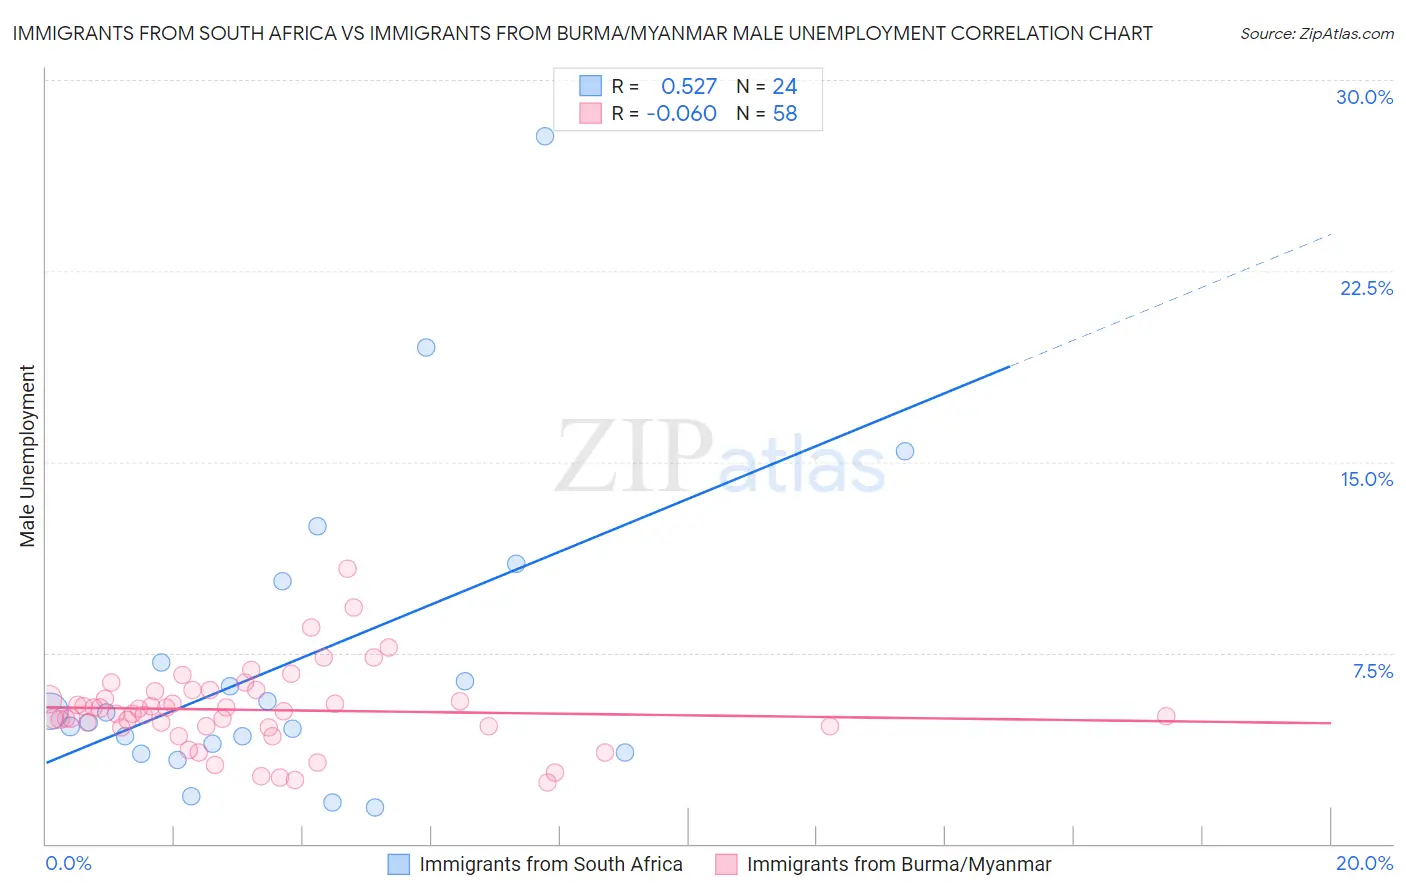
Immigrants from South Africa vs Immigrants from Burma/Myanmar Male Unemployment Correlation Chart
The statistical analysis conducted on geographies consisting of 232,631,377 people shows a substantial positive correlation between the proportion of Immigrants from South Africa and unemployment rate among males in the United States with a correlation coefficient (R) of 0.527 and weighted average of 5.0%. Similarly, the statistical analysis conducted on geographies consisting of 172,208,828 people shows a slight negative correlation between the proportion of Immigrants from Burma/Myanmar and unemployment rate among males in the United States with a correlation coefficient (R) of -0.060 and weighted average of 5.2%, a difference of 3.5%.
Male Unemployment Correlation Summary
| Measurement | Immigrants from South Africa | Immigrants from Burma/Myanmar |
| Minimum | 1.4% | 2.4% |
| Maximum | 27.8% | 10.8% |
| Range | 26.4% | 8.4% |
| Mean | 7.2% | 5.3% |
| Median | 5.0% | 5.2% |
| Interquartile 25% (IQ1) | 3.8% | 4.6% |
| Interquartile 75% (IQ3) | 8.7% | 6.0% |
| Interquartile Range (IQR) | 5.0% | 1.4% |
| Standard Deviation (Sample) | 6.2% | 1.6% |
| Standard Deviation (Population) | 6.1% | 1.6% |
Similar Demographics by Male Unemployment
Demographics Similar to Immigrants from South Africa by Male Unemployment
In terms of male unemployment, the demographic groups most similar to Immigrants from South Africa are New Zealander (5.0%, a difference of 0.070%), Greek (5.0%, a difference of 0.080%), White/Caucasian (5.0%, a difference of 0.090%), Immigrants from North America (5.0%, a difference of 0.11%), and Assyrian/Chaldean/Syriac (5.0%, a difference of 0.14%).
| Demographics | Rating | Rank | Male Unemployment |
| Icelanders | 97.6 /100 | #65 | Exceptional 5.0% |
| Finns | 97.5 /100 | #66 | Exceptional 5.0% |
| Immigrants | Canada | 97.5 /100 | #67 | Exceptional 5.0% |
| Australians | 97.4 /100 | #68 | Exceptional 5.0% |
| Immigrants | Sweden | 97.4 /100 | #69 | Exceptional 5.0% |
| Whites/Caucasians | 97.3 /100 | #70 | Exceptional 5.0% |
| New Zealanders | 97.3 /100 | #71 | Exceptional 5.0% |
| Immigrants | South Africa | 97.1 /100 | #72 | Exceptional 5.0% |
| Greeks | 97.0 /100 | #73 | Exceptional 5.0% |
| Immigrants | North America | 96.9 /100 | #74 | Exceptional 5.0% |
| Assyrians/Chaldeans/Syriacs | 96.9 /100 | #75 | Exceptional 5.0% |
| Immigrants | Sudan | 96.5 /100 | #76 | Exceptional 5.0% |
| Iranians | 96.4 /100 | #77 | Exceptional 5.0% |
| Immigrants | Northern Europe | 96.4 /100 | #78 | Exceptional 5.0% |
| South Africans | 96.4 /100 | #79 | Exceptional 5.0% |
Demographics Similar to Immigrants from Burma/Myanmar by Male Unemployment
In terms of male unemployment, the demographic groups most similar to Immigrants from Burma/Myanmar are Immigrants from Kenya (5.2%, a difference of 0.010%), Macedonian (5.2%, a difference of 0.020%), Sri Lankan (5.2%, a difference of 0.030%), Syrian (5.2%, a difference of 0.040%), and Fijian (5.2%, a difference of 0.070%).
| Demographics | Rating | Rank | Male Unemployment |
| Brazilians | 79.3 /100 | #140 | Good 5.2% |
| Immigrants | Switzerland | 79.2 /100 | #141 | Good 5.2% |
| Fijians | 78.3 /100 | #142 | Good 5.2% |
| Syrians | 78.0 /100 | #143 | Good 5.2% |
| Sri Lankans | 77.9 /100 | #144 | Good 5.2% |
| Macedonians | 77.7 /100 | #145 | Good 5.2% |
| Immigrants | Kenya | 77.6 /100 | #146 | Good 5.2% |
| Immigrants | Burma/Myanmar | 77.5 /100 | #147 | Good 5.2% |
| Immigrants | Italy | 76.3 /100 | #148 | Good 5.2% |
| Immigrants | Europe | 76.2 /100 | #149 | Good 5.2% |
| Indians (Asian) | 76.0 /100 | #150 | Good 5.2% |
| Slovaks | 75.5 /100 | #151 | Good 5.2% |
| Egyptians | 74.8 /100 | #152 | Good 5.2% |
| Immigrants | Uruguay | 73.9 /100 | #153 | Good 5.2% |
| Laotians | 73.8 /100 | #154 | Good 5.2% |