Immigrants from Vietnam vs Immigrants from Burma/Myanmar Male Unemployment
COMPARE
Immigrants from Vietnam
Immigrants from Burma/Myanmar
Male Unemployment
Male Unemployment Comparison
Immigrants from Vietnam
Immigrants from Burma/Myanmar
5.3%
MALE UNEMPLOYMENT
58.1/ 100
METRIC RATING
167th/ 347
METRIC RANK
5.2%
MALE UNEMPLOYMENT
77.5/ 100
METRIC RATING
147th/ 347
METRIC RANK
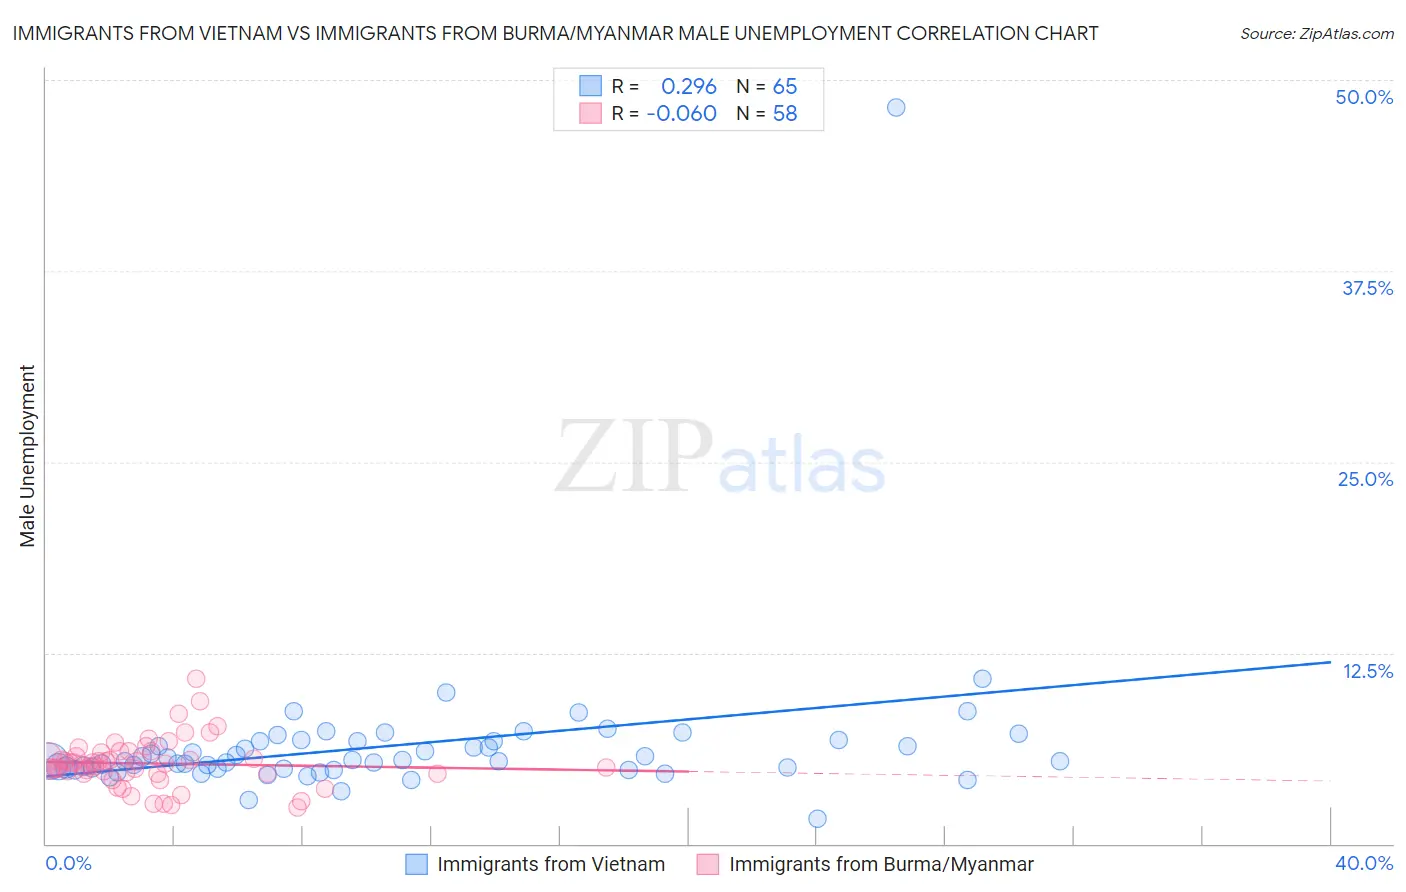
Immigrants from Vietnam vs Immigrants from Burma/Myanmar Male Unemployment Correlation Chart
The statistical analysis conducted on geographies consisting of 403,387,433 people shows a weak positive correlation between the proportion of Immigrants from Vietnam and unemployment rate among males in the United States with a correlation coefficient (R) of 0.296 and weighted average of 5.3%. Similarly, the statistical analysis conducted on geographies consisting of 172,208,828 people shows a slight negative correlation between the proportion of Immigrants from Burma/Myanmar and unemployment rate among males in the United States with a correlation coefficient (R) of -0.060 and weighted average of 5.2%, a difference of 1.3%.
Male Unemployment Correlation Summary
| Measurement | Immigrants from Vietnam | Immigrants from Burma/Myanmar |
| Minimum | 1.6% | 2.4% |
| Maximum | 48.2% | 10.8% |
| Range | 46.6% | 8.4% |
| Mean | 6.4% | 5.3% |
| Median | 5.4% | 5.2% |
| Interquartile 25% (IQ1) | 4.9% | 4.6% |
| Interquartile 75% (IQ3) | 6.7% | 6.0% |
| Interquartile Range (IQR) | 1.8% | 1.4% |
| Standard Deviation (Sample) | 5.5% | 1.6% |
| Standard Deviation (Population) | 5.4% | 1.6% |
Demographics Similar to Immigrants from Vietnam and Immigrants from Burma/Myanmar by Male Unemployment
In terms of male unemployment, the demographic groups most similar to Immigrants from Vietnam are Immigrants from Morocco (5.3%, a difference of 0.12%), South American (5.3%, a difference of 0.15%), Afghan (5.3%, a difference of 0.23%), Immigrants from Hong Kong (5.2%, a difference of 0.47%), and Immigrants from Egypt (5.2%, a difference of 0.49%). Similarly, the demographic groups most similar to Immigrants from Burma/Myanmar are Immigrants from Italy (5.2%, a difference of 0.10%), Immigrants from Europe (5.2%, a difference of 0.11%), Indian (Asian) (5.2%, a difference of 0.12%), Slovak (5.2%, a difference of 0.16%), and Egyptian (5.2%, a difference of 0.22%).
| Demographics | Rating | Rank | Male Unemployment |
| Immigrants | Burma/Myanmar | 77.5 /100 | #147 | Good 5.2% |
| Immigrants | Italy | 76.3 /100 | #148 | Good 5.2% |
| Immigrants | Europe | 76.2 /100 | #149 | Good 5.2% |
| Indians (Asian) | 76.0 /100 | #150 | Good 5.2% |
| Slovaks | 75.5 /100 | #151 | Good 5.2% |
| Egyptians | 74.8 /100 | #152 | Good 5.2% |
| Immigrants | Uruguay | 73.9 /100 | #153 | Good 5.2% |
| Laotians | 73.8 /100 | #154 | Good 5.2% |
| Immigrants | Hungary | 73.4 /100 | #155 | Good 5.2% |
| Americans | 72.7 /100 | #156 | Good 5.2% |
| Immigrants | Northern Africa | 72.3 /100 | #157 | Good 5.2% |
| Immigrants | Indonesia | 71.5 /100 | #158 | Good 5.2% |
| Indonesians | 71.2 /100 | #159 | Good 5.2% |
| Immigrants | Norway | 71.0 /100 | #160 | Good 5.2% |
| Immigrants | China | 70.6 /100 | #161 | Good 5.2% |
| Immigrants | Egypt | 65.9 /100 | #162 | Good 5.2% |
| Immigrants | Hong Kong | 65.7 /100 | #163 | Good 5.2% |
| Afghans | 62.0 /100 | #164 | Good 5.3% |
| South Americans | 60.6 /100 | #165 | Good 5.3% |
| Immigrants | Morocco | 60.2 /100 | #166 | Good 5.3% |
| Immigrants | Vietnam | 58.1 /100 | #167 | Average 5.3% |