African vs Bermudan Associate's Degree
COMPARE
African
Bermudan
Associate's Degree
Associate's Degree Comparison
Africans
Bermudans
41.1%
ASSOCIATE'S DEGREE
0.2/ 100
METRIC RATING
265th/ 347
METRIC RANK
46.2%
ASSOCIATE'S DEGREE
46.4/ 100
METRIC RATING
180th/ 347
METRIC RANK
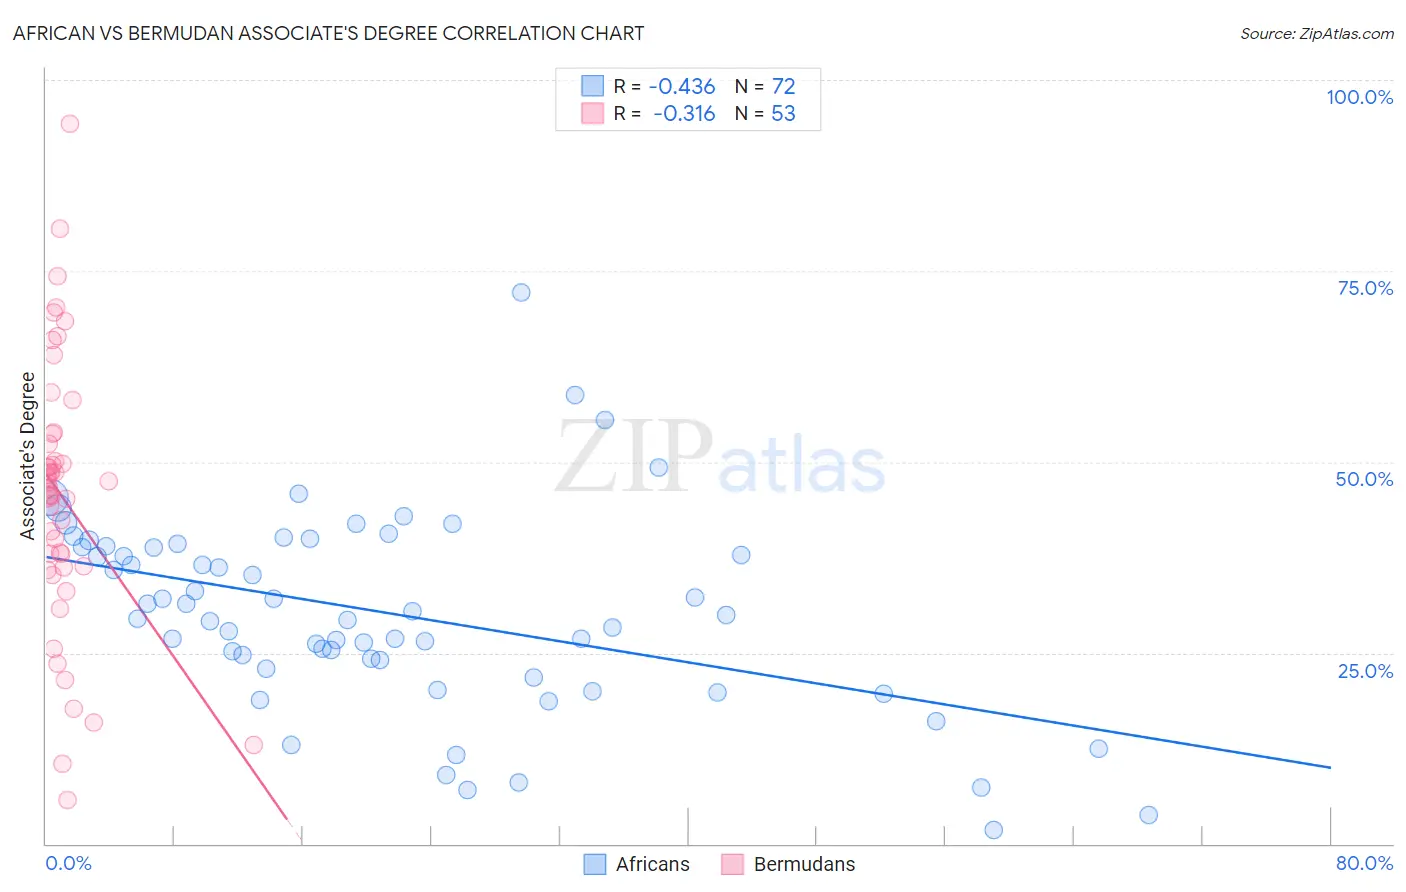
African vs Bermudan Associate's Degree Correlation Chart
The statistical analysis conducted on geographies consisting of 470,057,267 people shows a moderate negative correlation between the proportion of Africans and percentage of population with at least associate's degree education in the United States with a correlation coefficient (R) of -0.436 and weighted average of 41.1%. Similarly, the statistical analysis conducted on geographies consisting of 55,732,793 people shows a mild negative correlation between the proportion of Bermudans and percentage of population with at least associate's degree education in the United States with a correlation coefficient (R) of -0.316 and weighted average of 46.2%, a difference of 12.4%.
Associate's Degree Correlation Summary
| Measurement | African | Bermudan |
| Minimum | 1.7% | 5.7% |
| Maximum | 72.2% | 94.2% |
| Range | 70.5% | 88.5% |
| Mean | 30.2% | 45.5% |
| Median | 29.7% | 46.6% |
| Interquartile 25% (IQ1) | 23.5% | 36.2% |
| Interquartile 75% (IQ3) | 38.9% | 53.0% |
| Interquartile Range (IQR) | 15.4% | 16.8% |
| Standard Deviation (Sample) | 12.9% | 17.5% |
| Standard Deviation (Population) | 12.8% | 17.4% |
Similar Demographics by Associate's Degree
Demographics Similar to Africans by Associate's Degree
In terms of associate's degree, the demographic groups most similar to Africans are Samoan (41.1%, a difference of 0.0%), Hawaiian (40.9%, a difference of 0.56%), Osage (41.5%, a difference of 0.76%), Central American Indian (40.8%, a difference of 0.76%), and Immigrants from Jamaica (41.5%, a difference of 0.77%).
| Demographics | Rating | Rank | Associate's Degree |
| Japanese | 0.5 /100 | #258 | Tragic 41.7% |
| Malaysians | 0.4 /100 | #259 | Tragic 41.6% |
| Marshallese | 0.4 /100 | #260 | Tragic 41.6% |
| Nicaraguans | 0.4 /100 | #261 | Tragic 41.5% |
| Bahamians | 0.4 /100 | #262 | Tragic 41.5% |
| Immigrants | Jamaica | 0.3 /100 | #263 | Tragic 41.5% |
| Osage | 0.3 /100 | #264 | Tragic 41.5% |
| Africans | 0.2 /100 | #265 | Tragic 41.1% |
| Samoans | 0.2 /100 | #266 | Tragic 41.1% |
| Hawaiians | 0.2 /100 | #267 | Tragic 40.9% |
| Central American Indians | 0.2 /100 | #268 | Tragic 40.8% |
| Americans | 0.2 /100 | #269 | Tragic 40.8% |
| Chippewa | 0.2 /100 | #270 | Tragic 40.7% |
| Immigrants | Laos | 0.1 /100 | #271 | Tragic 40.7% |
| Belizeans | 0.1 /100 | #272 | Tragic 40.6% |
Demographics Similar to Bermudans by Associate's Degree
In terms of associate's degree, the demographic groups most similar to Bermudans are Sri Lankan (46.3%, a difference of 0.090%), Immigrants from Bosnia and Herzegovina (46.3%, a difference of 0.14%), Slovak (46.3%, a difference of 0.15%), Finnish (46.3%, a difference of 0.16%), and Belgian (46.3%, a difference of 0.19%).
| Demographics | Rating | Rank | Associate's Degree |
| Immigrants | Iraq | 50.3 /100 | #173 | Average 46.4% |
| English | 50.0 /100 | #174 | Average 46.4% |
| Belgians | 48.9 /100 | #175 | Average 46.3% |
| Finns | 48.5 /100 | #176 | Average 46.3% |
| Slovaks | 48.4 /100 | #177 | Average 46.3% |
| Immigrants | Bosnia and Herzegovina | 48.3 /100 | #178 | Average 46.3% |
| Sri Lankans | 47.6 /100 | #179 | Average 46.3% |
| Bermudans | 46.4 /100 | #180 | Average 46.2% |
| Immigrants | Colombia | 41.3 /100 | #181 | Average 46.0% |
| Swiss | 40.4 /100 | #182 | Average 46.0% |
| Yugoslavians | 40.2 /100 | #183 | Average 46.0% |
| Czechoslovakians | 40.0 /100 | #184 | Average 46.0% |
| Costa Ricans | 38.6 /100 | #185 | Fair 46.0% |
| Welsh | 37.9 /100 | #186 | Fair 45.9% |
| Immigrants | Uruguay | 35.5 /100 | #187 | Fair 45.8% |