Zip Codes with the Highest Percentage of Population Employed in Legal Services & Support in Greenville, SC
RELATED REPORTS & OPTIONS
Legal Services & Support
Greenville
Compare Zip Codes
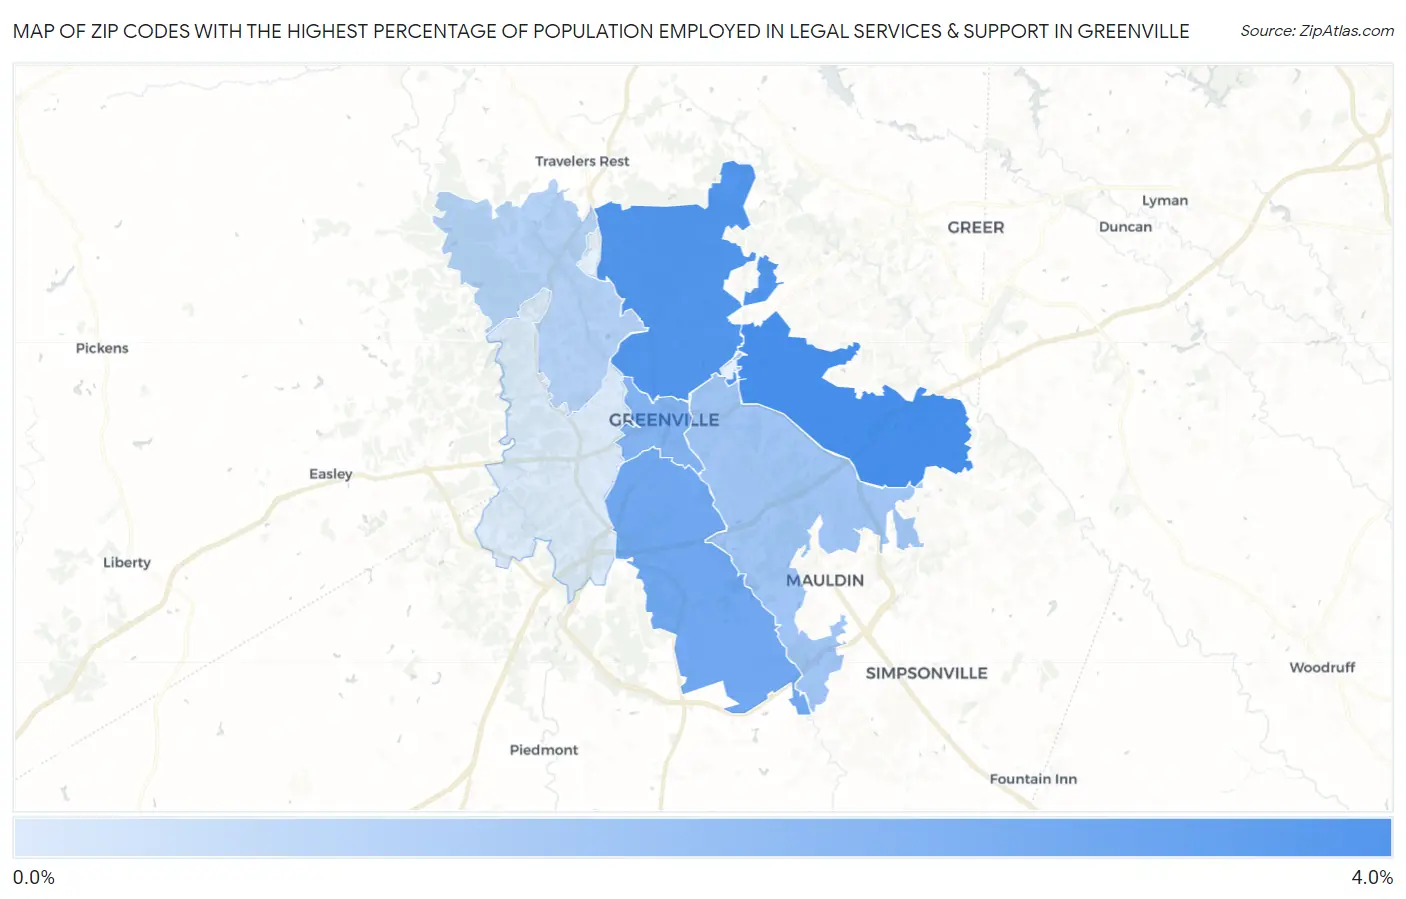
Map of Zip Codes with the Highest Percentage of Population Employed in Legal Services & Support in Greenville
0.27%
3.2%
Zip Codes with the Highest Percentage of Population Employed in Legal Services & Support in Greenville, SC
| Zip Code | % Employed | vs State | vs National | |
| 1. | 29615 | 3.2% | 0.97%(+2.24)#14 | 1.2%(+2.03)#1,642 |
| 2. | 29609 | 3.0% | 0.97%(+2.03)#16 | 1.2%(+1.82)#1,844 |
| 3. | 29605 | 2.4% | 0.97%(+1.43)#23 | 1.2%(+1.22)#2,669 |
| 4. | 29601 | 2.0% | 0.97%(+1.07)#31 | 1.2%(+0.856)#3,364 |
| 5. | 29607 | 1.4% | 0.97%(+0.468)#61 | 1.2%(+0.259)#5,283 |
| 6. | 29617 | 1.0% | 0.97%(+0.040)#89 | 1.2%(-0.170)#7,724 |
| 7. | 29611 | 0.27% | 0.97%(-0.708)#199 | 1.2%(-0.917)#15,432 |
1
Common Questions
What are the Top 5 Zip Codes with the Highest Percentage of Population Employed in Legal Services & Support in Greenville, SC?
Top 5 Zip Codes with the Highest Percentage of Population Employed in Legal Services & Support in Greenville, SC are:
What zip code has the Highest Percentage of Population Employed in Legal Services & Support in Greenville, SC?
29615 has the Highest Percentage of Population Employed in Legal Services & Support in Greenville, SC with 3.2%.
What is the Percentage of Population Employed in Legal Services & Support in Greenville, SC?
Percentage of Population Employed in Legal Services & Support in Greenville is 2.9%.
What is the Percentage of Population Employed in Legal Services & Support in South Carolina?
Percentage of Population Employed in Legal Services & Support in South Carolina is 0.97%.
What is the Percentage of Population Employed in Legal Services & Support in the United States?
Percentage of Population Employed in Legal Services & Support in the United States is 1.2%.