Zimbabwean vs Liberian Female Poverty
COMPARE
Zimbabwean
Liberian
Female Poverty
Female Poverty Comparison
Zimbabweans
Liberians
12.3%
FEMALE POVERTY
97.5/ 100
METRIC RATING
73rd/ 347
METRIC RANK
15.4%
FEMALE POVERTY
0.2/ 100
METRIC RATING
253rd/ 347
METRIC RANK
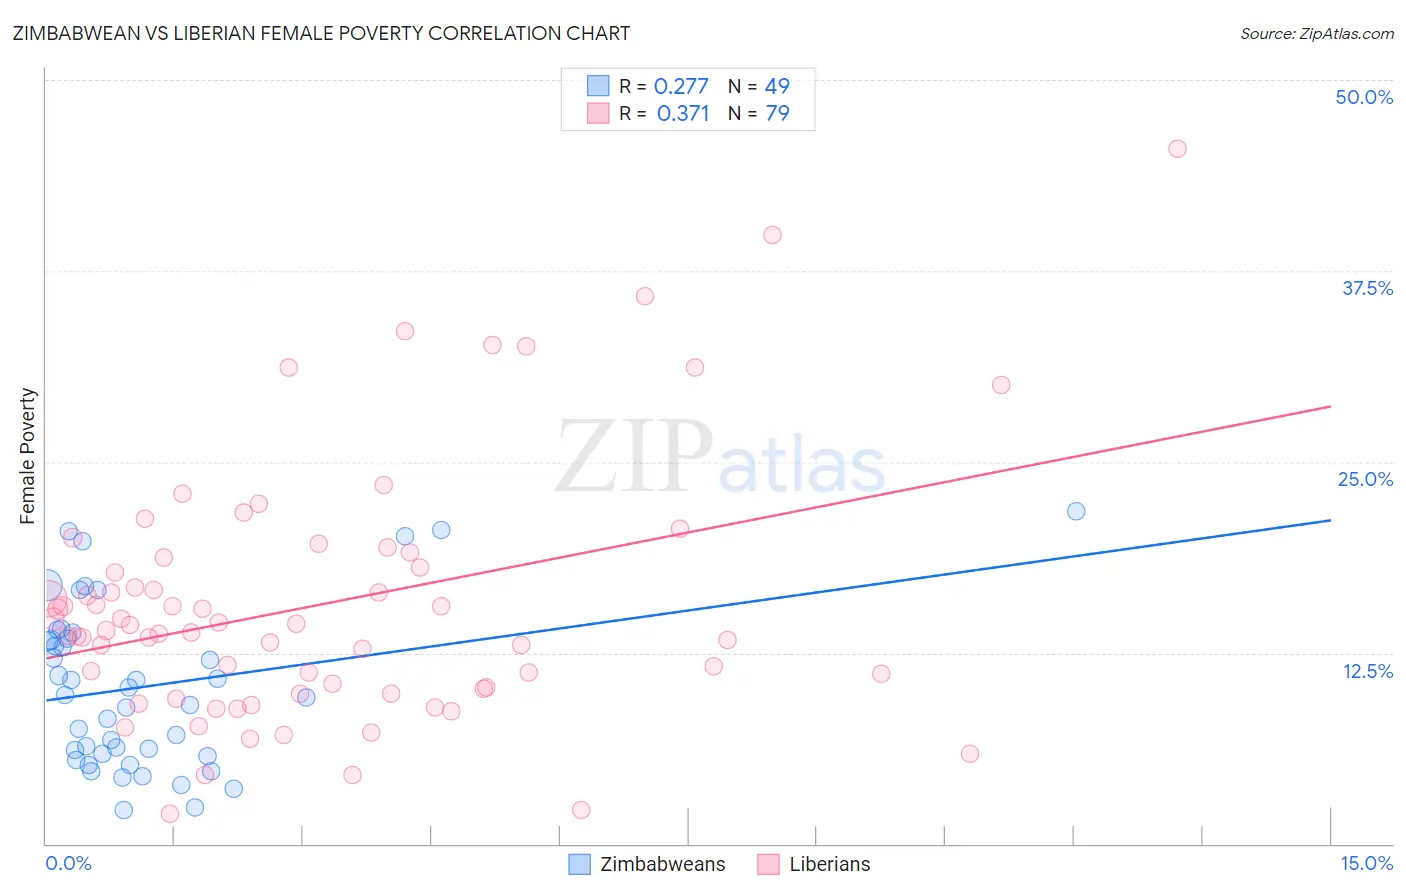
Zimbabwean vs Liberian Female Poverty Correlation Chart
The statistical analysis conducted on geographies consisting of 69,185,827 people shows a weak positive correlation between the proportion of Zimbabweans and poverty level among females in the United States with a correlation coefficient (R) of 0.277 and weighted average of 12.3%. Similarly, the statistical analysis conducted on geographies consisting of 118,038,056 people shows a mild positive correlation between the proportion of Liberians and poverty level among females in the United States with a correlation coefficient (R) of 0.371 and weighted average of 15.4%, a difference of 25.7%.
Female Poverty Correlation Summary
| Measurement | Zimbabwean | Liberian |
| Minimum | 2.2% | 1.9% |
| Maximum | 21.7% | 45.5% |
| Range | 19.5% | 43.6% |
| Mean | 10.3% | 15.7% |
| Median | 9.7% | 14.0% |
| Interquartile 25% (IQ1) | 5.8% | 10.2% |
| Interquartile 75% (IQ3) | 13.6% | 18.8% |
| Interquartile Range (IQR) | 7.8% | 8.6% |
| Standard Deviation (Sample) | 5.3% | 8.4% |
| Standard Deviation (Population) | 5.2% | 8.3% |
Similar Demographics by Female Poverty
Demographics Similar to Zimbabweans by Female Poverty
In terms of female poverty, the demographic groups most similar to Zimbabweans are Immigrants from Canada (12.3%, a difference of 0.010%), Cambodian (12.2%, a difference of 0.020%), Carpatho Rusyn (12.2%, a difference of 0.050%), European (12.3%, a difference of 0.13%), and Immigrants from Belgium (12.2%, a difference of 0.18%).
| Demographics | Rating | Rank | Female Poverty |
| Austrians | 97.9 /100 | #66 | Exceptional 12.2% |
| Immigrants | Eastern Asia | 97.8 /100 | #67 | Exceptional 12.2% |
| Immigrants | Netherlands | 97.8 /100 | #68 | Exceptional 12.2% |
| Swiss | 97.7 /100 | #69 | Exceptional 12.2% |
| Immigrants | Belgium | 97.7 /100 | #70 | Exceptional 12.2% |
| Carpatho Rusyns | 97.6 /100 | #71 | Exceptional 12.2% |
| Cambodians | 97.5 /100 | #72 | Exceptional 12.2% |
| Zimbabweans | 97.5 /100 | #73 | Exceptional 12.3% |
| Immigrants | Canada | 97.5 /100 | #74 | Exceptional 12.3% |
| Europeans | 97.4 /100 | #75 | Exceptional 12.3% |
| Immigrants | Eastern Europe | 97.2 /100 | #76 | Exceptional 12.3% |
| Serbians | 97.2 /100 | #77 | Exceptional 12.3% |
| Egyptians | 97.2 /100 | #78 | Exceptional 12.3% |
| Immigrants | North America | 97.1 /100 | #79 | Exceptional 12.3% |
| Slovaks | 97.1 /100 | #80 | Exceptional 12.3% |
Demographics Similar to Liberians by Female Poverty
In terms of female poverty, the demographic groups most similar to Liberians are Trinidadian and Tobagonian (15.4%, a difference of 0.24%), Immigrants from Burma/Myanmar (15.4%, a difference of 0.26%), Immigrants from Trinidad and Tobago (15.4%, a difference of 0.30%), Immigrants from Western Africa (15.3%, a difference of 0.45%), and Salvadoran (15.3%, a difference of 0.50%).
| Demographics | Rating | Rank | Female Poverty |
| Cubans | 0.3 /100 | #246 | Tragic 15.3% |
| Potawatomi | 0.3 /100 | #247 | Tragic 15.3% |
| Immigrants | Ghana | 0.3 /100 | #248 | Tragic 15.3% |
| Salvadorans | 0.3 /100 | #249 | Tragic 15.3% |
| Immigrants | Western Africa | 0.3 /100 | #250 | Tragic 15.3% |
| Immigrants | Trinidad and Tobago | 0.3 /100 | #251 | Tragic 15.4% |
| Immigrants | Burma/Myanmar | 0.3 /100 | #252 | Tragic 15.4% |
| Liberians | 0.2 /100 | #253 | Tragic 15.4% |
| Trinidadians and Tobagonians | 0.2 /100 | #254 | Tragic 15.4% |
| Ottawa | 0.2 /100 | #255 | Tragic 15.5% |
| Jamaicans | 0.2 /100 | #256 | Tragic 15.5% |
| Immigrants | Jamaica | 0.1 /100 | #257 | Tragic 15.6% |
| Shoshone | 0.1 /100 | #258 | Tragic 15.6% |
| Cape Verdeans | 0.1 /100 | #259 | Tragic 15.6% |
| Immigrants | Guyana | 0.1 /100 | #260 | Tragic 15.6% |