Zimbabwean vs Immigrants from Bolivia Female Poverty
COMPARE
Zimbabwean
Immigrants from Bolivia
Female Poverty
Female Poverty Comparison
Zimbabweans
Immigrants from Bolivia
12.3%
FEMALE POVERTY
97.5/ 100
METRIC RATING
73rd/ 347
METRIC RANK
11.5%
FEMALE POVERTY
99.8/ 100
METRIC RATING
16th/ 347
METRIC RANK
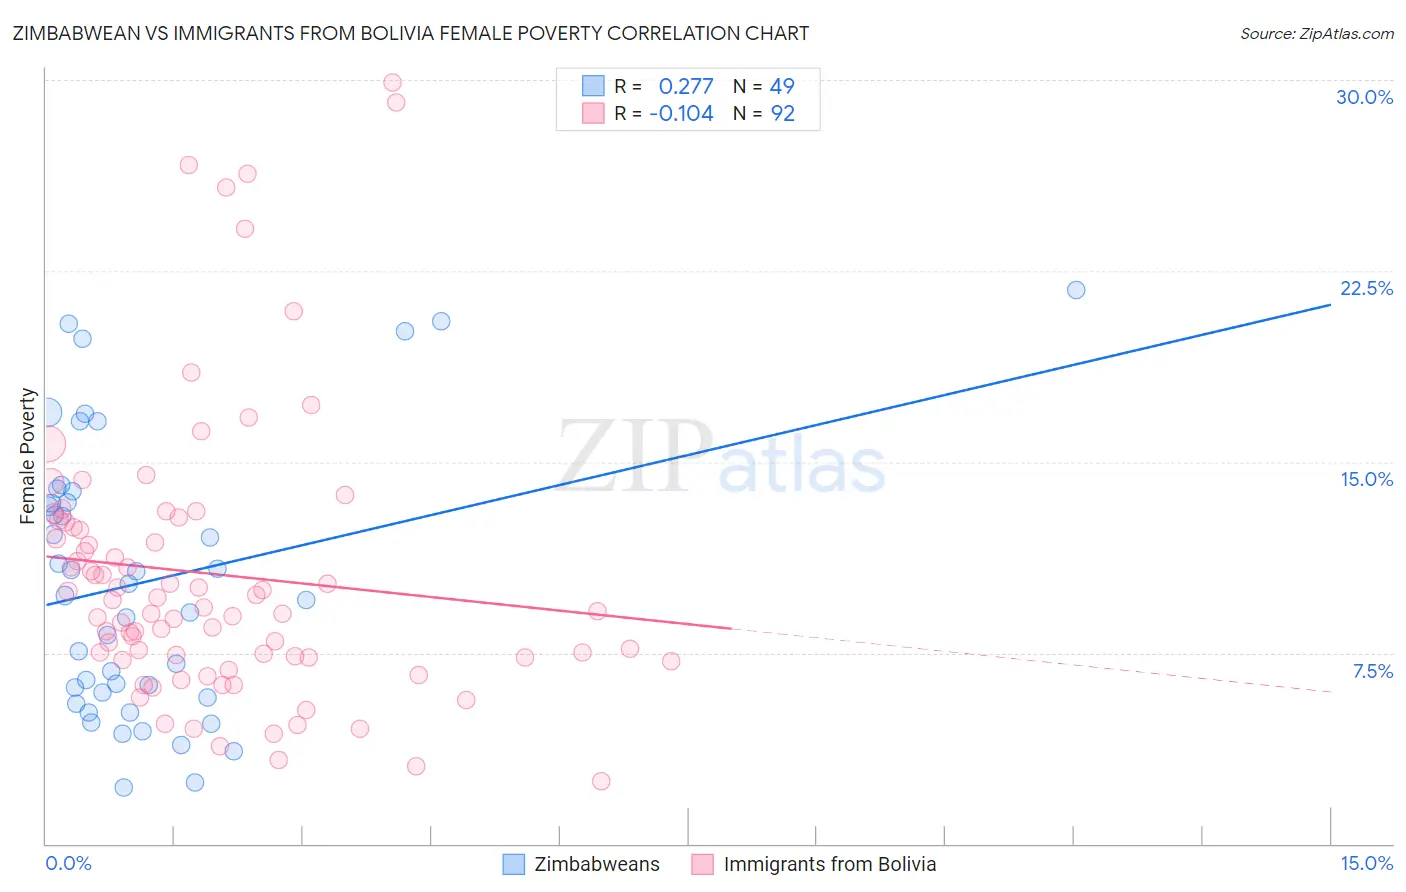
Zimbabwean vs Immigrants from Bolivia Female Poverty Correlation Chart
The statistical analysis conducted on geographies consisting of 69,185,827 people shows a weak positive correlation between the proportion of Zimbabweans and poverty level among females in the United States with a correlation coefficient (R) of 0.277 and weighted average of 12.3%. Similarly, the statistical analysis conducted on geographies consisting of 158,699,026 people shows a poor negative correlation between the proportion of Immigrants from Bolivia and poverty level among females in the United States with a correlation coefficient (R) of -0.104 and weighted average of 11.5%, a difference of 6.7%.
Female Poverty Correlation Summary
| Measurement | Zimbabwean | Immigrants from Bolivia |
| Minimum | 2.2% | 2.4% |
| Maximum | 21.7% | 29.9% |
| Range | 19.5% | 27.5% |
| Mean | 10.3% | 10.6% |
| Median | 9.7% | 9.2% |
| Interquartile 25% (IQ1) | 5.8% | 7.3% |
| Interquartile 75% (IQ3) | 13.6% | 12.5% |
| Interquartile Range (IQR) | 7.8% | 5.2% |
| Standard Deviation (Sample) | 5.3% | 5.6% |
| Standard Deviation (Population) | 5.2% | 5.6% |
Similar Demographics by Female Poverty
Demographics Similar to Zimbabweans by Female Poverty
In terms of female poverty, the demographic groups most similar to Zimbabweans are Immigrants from Canada (12.3%, a difference of 0.010%), Cambodian (12.2%, a difference of 0.020%), Carpatho Rusyn (12.2%, a difference of 0.050%), European (12.3%, a difference of 0.13%), and Immigrants from Belgium (12.2%, a difference of 0.18%).
| Demographics | Rating | Rank | Female Poverty |
| Austrians | 97.9 /100 | #66 | Exceptional 12.2% |
| Immigrants | Eastern Asia | 97.8 /100 | #67 | Exceptional 12.2% |
| Immigrants | Netherlands | 97.8 /100 | #68 | Exceptional 12.2% |
| Swiss | 97.7 /100 | #69 | Exceptional 12.2% |
| Immigrants | Belgium | 97.7 /100 | #70 | Exceptional 12.2% |
| Carpatho Rusyns | 97.6 /100 | #71 | Exceptional 12.2% |
| Cambodians | 97.5 /100 | #72 | Exceptional 12.2% |
| Zimbabweans | 97.5 /100 | #73 | Exceptional 12.3% |
| Immigrants | Canada | 97.5 /100 | #74 | Exceptional 12.3% |
| Europeans | 97.4 /100 | #75 | Exceptional 12.3% |
| Immigrants | Eastern Europe | 97.2 /100 | #76 | Exceptional 12.3% |
| Serbians | 97.2 /100 | #77 | Exceptional 12.3% |
| Egyptians | 97.2 /100 | #78 | Exceptional 12.3% |
| Immigrants | North America | 97.1 /100 | #79 | Exceptional 12.3% |
| Slovaks | 97.1 /100 | #80 | Exceptional 12.3% |
Demographics Similar to Immigrants from Bolivia by Female Poverty
In terms of female poverty, the demographic groups most similar to Immigrants from Bolivia are Bolivian (11.5%, a difference of 0.070%), Immigrants from Scotland (11.5%, a difference of 0.12%), Norwegian (11.5%, a difference of 0.16%), Eastern European (11.5%, a difference of 0.39%), and Latvian (11.4%, a difference of 0.47%).
| Demographics | Rating | Rank | Female Poverty |
| Bulgarians | 99.9 /100 | #9 | Exceptional 11.1% |
| Immigrants | Hong Kong | 99.9 /100 | #10 | Exceptional 11.2% |
| Maltese | 99.9 /100 | #11 | Exceptional 11.2% |
| Bhutanese | 99.9 /100 | #12 | Exceptional 11.3% |
| Immigrants | Lithuania | 99.9 /100 | #13 | Exceptional 11.3% |
| Lithuanians | 99.8 /100 | #14 | Exceptional 11.4% |
| Latvians | 99.8 /100 | #15 | Exceptional 11.4% |
| Immigrants | Bolivia | 99.8 /100 | #16 | Exceptional 11.5% |
| Bolivians | 99.8 /100 | #17 | Exceptional 11.5% |
| Immigrants | Scotland | 99.8 /100 | #18 | Exceptional 11.5% |
| Norwegians | 99.8 /100 | #19 | Exceptional 11.5% |
| Eastern Europeans | 99.7 /100 | #20 | Exceptional 11.5% |
| Italians | 99.7 /100 | #21 | Exceptional 11.6% |
| Swedes | 99.7 /100 | #22 | Exceptional 11.6% |
| Burmese | 99.7 /100 | #23 | Exceptional 11.6% |