Immigrants from North America vs Liberian Female Poverty
COMPARE
Immigrants from North America
Liberian
Female Poverty
Female Poverty Comparison
Immigrants from North America
Liberians
12.3%
FEMALE POVERTY
97.1/ 100
METRIC RATING
79th/ 347
METRIC RANK
15.4%
FEMALE POVERTY
0.2/ 100
METRIC RATING
253rd/ 347
METRIC RANK
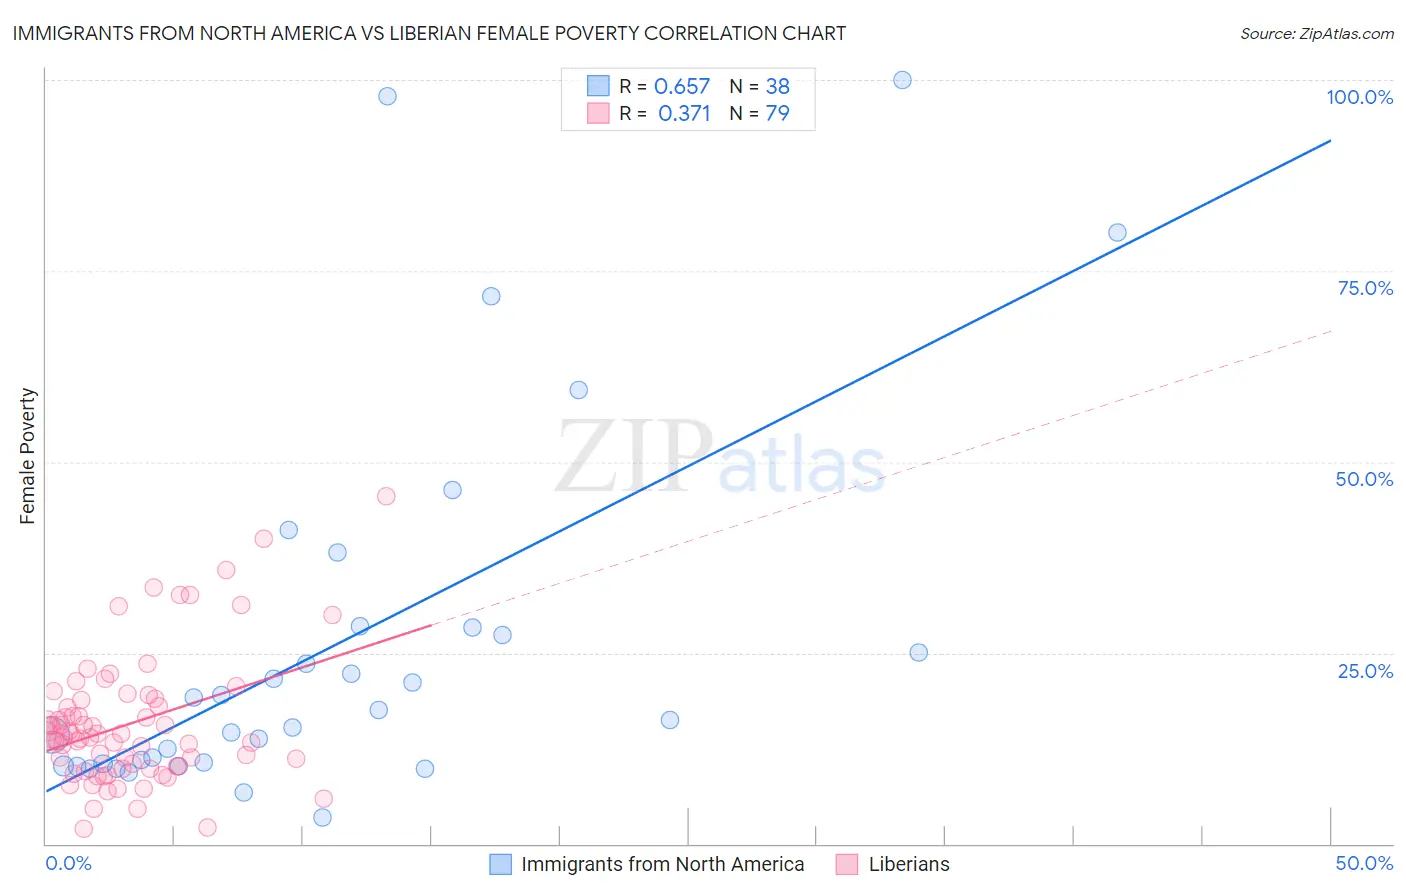
Immigrants from North America vs Liberian Female Poverty Correlation Chart
The statistical analysis conducted on geographies consisting of 462,028,692 people shows a significant positive correlation between the proportion of Immigrants from North America and poverty level among females in the United States with a correlation coefficient (R) of 0.657 and weighted average of 12.3%. Similarly, the statistical analysis conducted on geographies consisting of 118,038,056 people shows a mild positive correlation between the proportion of Liberians and poverty level among females in the United States with a correlation coefficient (R) of 0.371 and weighted average of 15.4%, a difference of 25.2%.
Female Poverty Correlation Summary
| Measurement | Immigrants from North America | Liberian |
| Minimum | 3.5% | 1.9% |
| Maximum | 100.0% | 45.5% |
| Range | 96.5% | 43.6% |
| Mean | 26.2% | 15.7% |
| Median | 16.9% | 14.0% |
| Interquartile 25% (IQ1) | 10.5% | 10.2% |
| Interquartile 75% (IQ3) | 28.3% | 18.8% |
| Interquartile Range (IQR) | 17.9% | 8.6% |
| Standard Deviation (Sample) | 24.5% | 8.4% |
| Standard Deviation (Population) | 24.2% | 8.3% |
Similar Demographics by Female Poverty
Demographics Similar to Immigrants from North America by Female Poverty
In terms of female poverty, the demographic groups most similar to Immigrants from North America are Slovak (12.3%, a difference of 0.050%), Immigrants from Sweden (12.3%, a difference of 0.050%), Jordanian (12.3%, a difference of 0.060%), Egyptian (12.3%, a difference of 0.070%), and Serbian (12.3%, a difference of 0.080%).
| Demographics | Rating | Rank | Female Poverty |
| Cambodians | 97.5 /100 | #72 | Exceptional 12.2% |
| Zimbabweans | 97.5 /100 | #73 | Exceptional 12.3% |
| Immigrants | Canada | 97.5 /100 | #74 | Exceptional 12.3% |
| Europeans | 97.4 /100 | #75 | Exceptional 12.3% |
| Immigrants | Eastern Europe | 97.2 /100 | #76 | Exceptional 12.3% |
| Serbians | 97.2 /100 | #77 | Exceptional 12.3% |
| Egyptians | 97.2 /100 | #78 | Exceptional 12.3% |
| Immigrants | North America | 97.1 /100 | #79 | Exceptional 12.3% |
| Slovaks | 97.1 /100 | #80 | Exceptional 12.3% |
| Immigrants | Sweden | 97.1 /100 | #81 | Exceptional 12.3% |
| Jordanians | 97.1 /100 | #82 | Exceptional 12.3% |
| Immigrants | England | 96.9 /100 | #83 | Exceptional 12.3% |
| Northern Europeans | 96.6 /100 | #84 | Exceptional 12.4% |
| Irish | 96.5 /100 | #85 | Exceptional 12.4% |
| Dutch | 96.5 /100 | #86 | Exceptional 12.4% |
Demographics Similar to Liberians by Female Poverty
In terms of female poverty, the demographic groups most similar to Liberians are Trinidadian and Tobagonian (15.4%, a difference of 0.24%), Immigrants from Burma/Myanmar (15.4%, a difference of 0.26%), Immigrants from Trinidad and Tobago (15.4%, a difference of 0.30%), Immigrants from Western Africa (15.3%, a difference of 0.45%), and Salvadoran (15.3%, a difference of 0.50%).
| Demographics | Rating | Rank | Female Poverty |
| Cubans | 0.3 /100 | #246 | Tragic 15.3% |
| Potawatomi | 0.3 /100 | #247 | Tragic 15.3% |
| Immigrants | Ghana | 0.3 /100 | #248 | Tragic 15.3% |
| Salvadorans | 0.3 /100 | #249 | Tragic 15.3% |
| Immigrants | Western Africa | 0.3 /100 | #250 | Tragic 15.3% |
| Immigrants | Trinidad and Tobago | 0.3 /100 | #251 | Tragic 15.4% |
| Immigrants | Burma/Myanmar | 0.3 /100 | #252 | Tragic 15.4% |
| Liberians | 0.2 /100 | #253 | Tragic 15.4% |
| Trinidadians and Tobagonians | 0.2 /100 | #254 | Tragic 15.4% |
| Ottawa | 0.2 /100 | #255 | Tragic 15.5% |
| Jamaicans | 0.2 /100 | #256 | Tragic 15.5% |
| Immigrants | Jamaica | 0.1 /100 | #257 | Tragic 15.6% |
| Shoshone | 0.1 /100 | #258 | Tragic 15.6% |
| Cape Verdeans | 0.1 /100 | #259 | Tragic 15.6% |
| Immigrants | Guyana | 0.1 /100 | #260 | Tragic 15.6% |