Immigrants from Singapore vs Liberian Female Poverty
COMPARE
Immigrants from Singapore
Liberian
Female Poverty
Female Poverty Comparison
Immigrants from Singapore
Liberians
11.8%
FEMALE POVERTY
99.4/ 100
METRIC RATING
34th/ 347
METRIC RANK
15.4%
FEMALE POVERTY
0.2/ 100
METRIC RATING
253rd/ 347
METRIC RANK
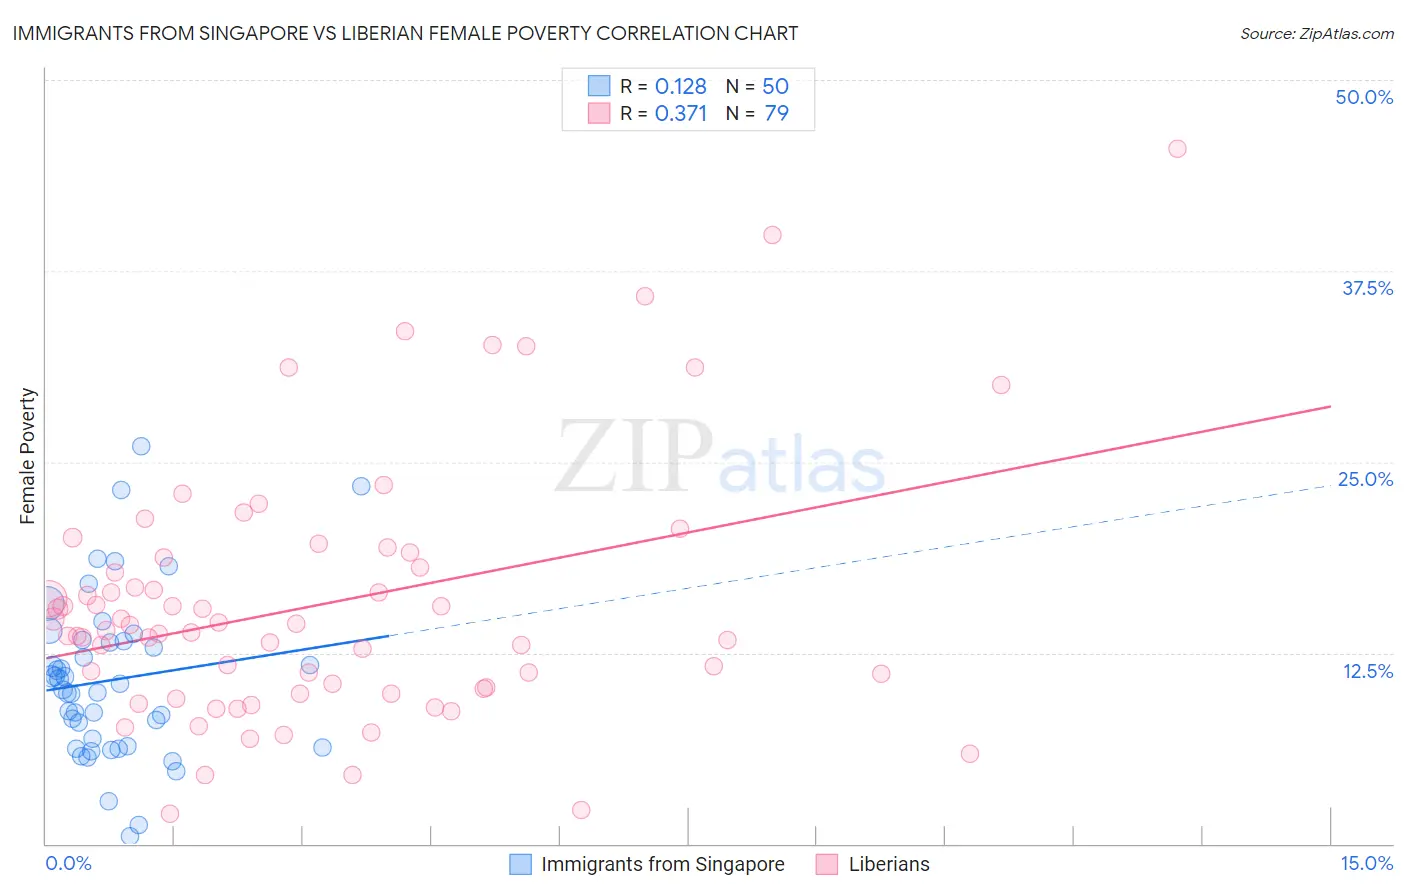
Immigrants from Singapore vs Liberian Female Poverty Correlation Chart
The statistical analysis conducted on geographies consisting of 137,378,092 people shows a poor positive correlation between the proportion of Immigrants from Singapore and poverty level among females in the United States with a correlation coefficient (R) of 0.128 and weighted average of 11.8%. Similarly, the statistical analysis conducted on geographies consisting of 118,038,056 people shows a mild positive correlation between the proportion of Liberians and poverty level among females in the United States with a correlation coefficient (R) of 0.371 and weighted average of 15.4%, a difference of 30.9%.
Female Poverty Correlation Summary
| Measurement | Immigrants from Singapore | Liberian |
| Minimum | 0.53% | 1.9% |
| Maximum | 26.0% | 45.5% |
| Range | 25.5% | 43.6% |
| Mean | 10.7% | 15.7% |
| Median | 10.3% | 14.0% |
| Interquartile 25% (IQ1) | 6.4% | 10.2% |
| Interquartile 75% (IQ3) | 13.2% | 18.8% |
| Interquartile Range (IQR) | 6.9% | 8.6% |
| Standard Deviation (Sample) | 5.4% | 8.4% |
| Standard Deviation (Population) | 5.3% | 8.3% |
Similar Demographics by Female Poverty
Demographics Similar to Immigrants from Singapore by Female Poverty
In terms of female poverty, the demographic groups most similar to Immigrants from Singapore are Cypriot (11.8%, a difference of 0.12%), Immigrants from Iran (11.8%, a difference of 0.17%), Danish (11.7%, a difference of 0.19%), Polish (11.7%, a difference of 0.32%), and Immigrants from Pakistan (11.8%, a difference of 0.34%).
| Demographics | Rating | Rank | Female Poverty |
| Iranians | 99.6 /100 | #27 | Exceptional 11.7% |
| Immigrants | Korea | 99.6 /100 | #28 | Exceptional 11.7% |
| Immigrants | North Macedonia | 99.6 /100 | #29 | Exceptional 11.7% |
| Greeks | 99.5 /100 | #30 | Exceptional 11.7% |
| Poles | 99.5 /100 | #31 | Exceptional 11.7% |
| Danes | 99.5 /100 | #32 | Exceptional 11.7% |
| Cypriots | 99.5 /100 | #33 | Exceptional 11.8% |
| Immigrants | Singapore | 99.4 /100 | #34 | Exceptional 11.8% |
| Immigrants | Iran | 99.4 /100 | #35 | Exceptional 11.8% |
| Immigrants | Pakistan | 99.4 /100 | #36 | Exceptional 11.8% |
| Immigrants | Greece | 99.3 /100 | #37 | Exceptional 11.8% |
| Russians | 99.3 /100 | #38 | Exceptional 11.8% |
| Immigrants | Poland | 99.3 /100 | #39 | Exceptional 11.8% |
| Macedonians | 99.3 /100 | #40 | Exceptional 11.8% |
| Czechs | 99.2 /100 | #41 | Exceptional 11.9% |
Demographics Similar to Liberians by Female Poverty
In terms of female poverty, the demographic groups most similar to Liberians are Trinidadian and Tobagonian (15.4%, a difference of 0.24%), Immigrants from Burma/Myanmar (15.4%, a difference of 0.26%), Immigrants from Trinidad and Tobago (15.4%, a difference of 0.30%), Immigrants from Western Africa (15.3%, a difference of 0.45%), and Salvadoran (15.3%, a difference of 0.50%).
| Demographics | Rating | Rank | Female Poverty |
| Cubans | 0.3 /100 | #246 | Tragic 15.3% |
| Potawatomi | 0.3 /100 | #247 | Tragic 15.3% |
| Immigrants | Ghana | 0.3 /100 | #248 | Tragic 15.3% |
| Salvadorans | 0.3 /100 | #249 | Tragic 15.3% |
| Immigrants | Western Africa | 0.3 /100 | #250 | Tragic 15.3% |
| Immigrants | Trinidad and Tobago | 0.3 /100 | #251 | Tragic 15.4% |
| Immigrants | Burma/Myanmar | 0.3 /100 | #252 | Tragic 15.4% |
| Liberians | 0.2 /100 | #253 | Tragic 15.4% |
| Trinidadians and Tobagonians | 0.2 /100 | #254 | Tragic 15.4% |
| Ottawa | 0.2 /100 | #255 | Tragic 15.5% |
| Jamaicans | 0.2 /100 | #256 | Tragic 15.5% |
| Immigrants | Jamaica | 0.1 /100 | #257 | Tragic 15.6% |
| Shoshone | 0.1 /100 | #258 | Tragic 15.6% |
| Cape Verdeans | 0.1 /100 | #259 | Tragic 15.6% |
| Immigrants | Guyana | 0.1 /100 | #260 | Tragic 15.6% |