Yup'ik vs Immigrants from Austria Single Father Poverty
COMPARE
Yup'ik
Immigrants from Austria
Single Father Poverty
Single Father Poverty Comparison
Yup'ik
Immigrants from Austria
32.5%
SINGLE FATHER POVERTY
0.0/ 100
METRIC RATING
347th/ 347
METRIC RANK
16.8%
SINGLE FATHER POVERTY
7.0/ 100
METRIC RATING
223rd/ 347
METRIC RANK
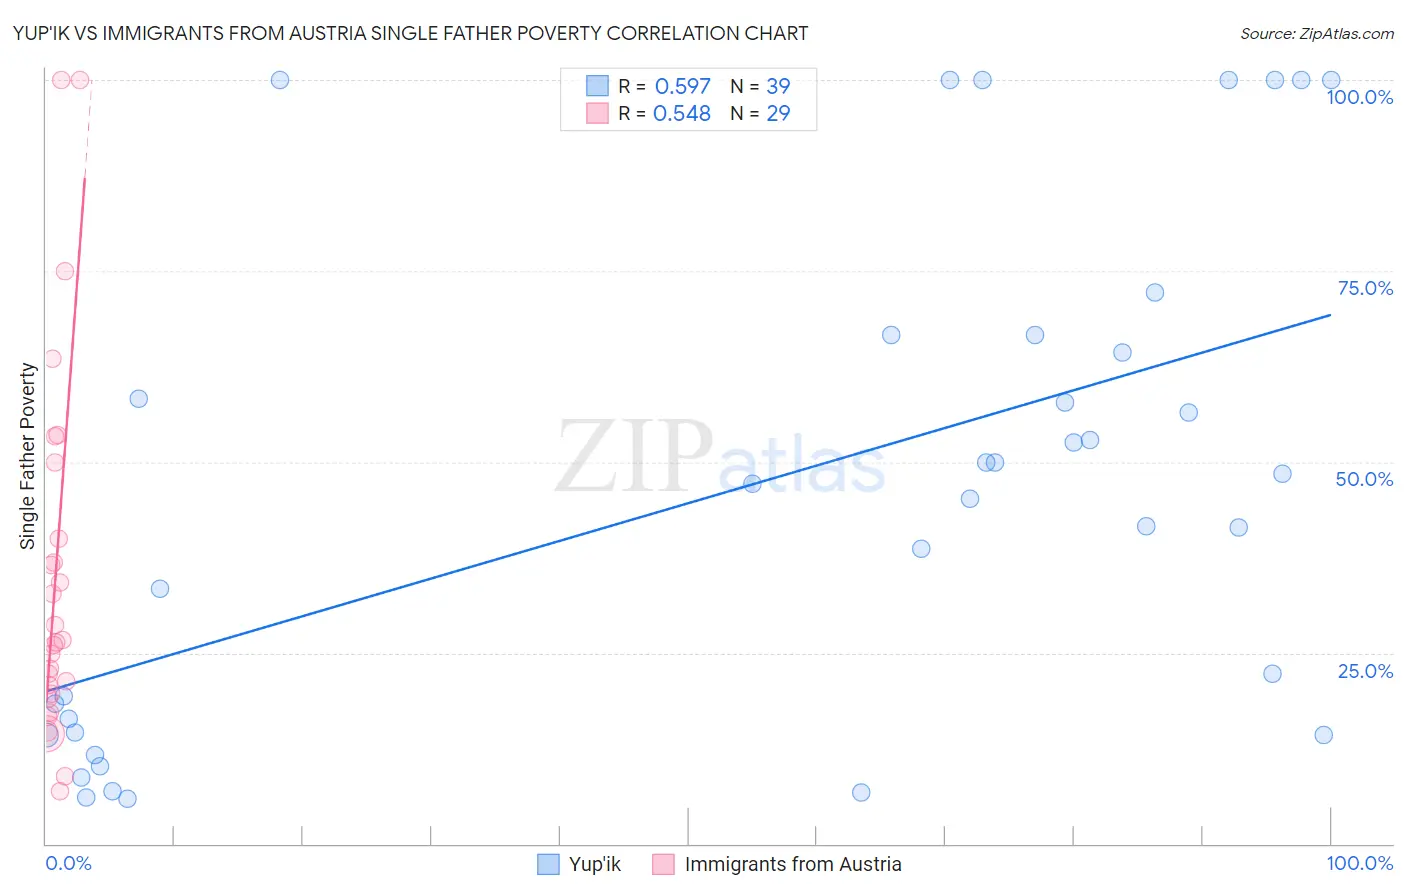
Yup'ik vs Immigrants from Austria Single Father Poverty Correlation Chart
The statistical analysis conducted on geographies consisting of 37,532,100 people shows a substantial positive correlation between the proportion of Yup'ik and poverty level among single fathers in the United States with a correlation coefficient (R) of 0.597 and weighted average of 32.5%. Similarly, the statistical analysis conducted on geographies consisting of 142,014,739 people shows a substantial positive correlation between the proportion of Immigrants from Austria and poverty level among single fathers in the United States with a correlation coefficient (R) of 0.548 and weighted average of 16.8%, a difference of 94.0%.
Single Father Poverty Correlation Summary
| Measurement | Yup'ik | Immigrants from Austria |
| Minimum | 5.9% | 6.9% |
| Maximum | 100.0% | 100.0% |
| Range | 94.1% | 93.1% |
| Mean | 46.6% | 34.9% |
| Median | 47.1% | 26.3% |
| Interquartile 25% (IQ1) | 14.6% | 19.4% |
| Interquartile 75% (IQ3) | 66.7% | 45.0% |
| Interquartile Range (IQR) | 52.0% | 25.6% |
| Standard Deviation (Sample) | 32.1% | 24.1% |
| Standard Deviation (Population) | 31.7% | 23.7% |
Similar Demographics by Single Father Poverty
Demographics Similar to Yup'ik by Single Father Poverty
In terms of single father poverty, the demographic groups most similar to Yup'ik are Puerto Rican (31.5%, a difference of 3.2%), Crow (30.3%, a difference of 7.4%), Navajo (29.2%, a difference of 11.3%), Lumbee (28.5%, a difference of 14.2%), and Yuman (28.4%, a difference of 14.6%).
| Demographics | Rating | Rank | Single Father Poverty |
| Natives/Alaskans | 0.0 /100 | #333 | Tragic 22.4% |
| Kiowa | 0.0 /100 | #334 | Tragic 22.5% |
| Shoshone | 0.0 /100 | #335 | Tragic 22.9% |
| Cajuns | 0.0 /100 | #336 | Tragic 23.1% |
| Sioux | 0.0 /100 | #337 | Tragic 23.9% |
| Arapaho | 0.0 /100 | #338 | Tragic 24.0% |
| Apache | 0.0 /100 | #339 | Tragic 24.2% |
| Houma | 0.0 /100 | #340 | Tragic 26.7% |
| Hopi | 0.0 /100 | #341 | Tragic 27.2% |
| Yuman | 0.0 /100 | #342 | Tragic 28.4% |
| Lumbee | 0.0 /100 | #343 | Tragic 28.5% |
| Navajo | 0.0 /100 | #344 | Tragic 29.2% |
| Crow | 0.0 /100 | #345 | Tragic 30.3% |
| Puerto Ricans | 0.0 /100 | #346 | Tragic 31.5% |
| Yup'ik | 0.0 /100 | #347 | Tragic 32.5% |
Demographics Similar to Immigrants from Austria by Single Father Poverty
In terms of single father poverty, the demographic groups most similar to Immigrants from Austria are Immigrants from Norway (16.8%, a difference of 0.080%), Menominee (16.8%, a difference of 0.10%), Hispanic or Latino (16.8%, a difference of 0.15%), Immigrants from Spain (16.7%, a difference of 0.16%), and Immigrants from Denmark (16.7%, a difference of 0.17%).
| Demographics | Rating | Rank | Single Father Poverty |
| Immigrants | England | 9.5 /100 | #216 | Tragic 16.7% |
| Cheyenne | 9.3 /100 | #217 | Tragic 16.7% |
| Immigrants | Uganda | 8.6 /100 | #218 | Tragic 16.7% |
| Immigrants | Ghana | 8.1 /100 | #219 | Tragic 16.7% |
| Immigrants | Denmark | 8.1 /100 | #220 | Tragic 16.7% |
| Immigrants | Greece | 8.1 /100 | #221 | Tragic 16.7% |
| Immigrants | Spain | 8.0 /100 | #222 | Tragic 16.7% |
| Immigrants | Austria | 7.0 /100 | #223 | Tragic 16.8% |
| Immigrants | Norway | 6.5 /100 | #224 | Tragic 16.8% |
| Menominee | 6.4 /100 | #225 | Tragic 16.8% |
| Hispanics or Latinos | 6.1 /100 | #226 | Tragic 16.8% |
| British | 5.6 /100 | #227 | Tragic 16.8% |
| Belgians | 5.3 /100 | #228 | Tragic 16.8% |
| Israelis | 4.6 /100 | #229 | Tragic 16.8% |
| Immigrants | Trinidad and Tobago | 4.5 /100 | #230 | Tragic 16.8% |