Yup'ik vs Immigrants from Central America Single Father Poverty
COMPARE
Yup'ik
Immigrants from Central America
Single Father Poverty
Single Father Poverty Comparison
Yup'ik
Immigrants from Central America
32.5%
SINGLE FATHER POVERTY
0.0/ 100
METRIC RATING
347th/ 347
METRIC RANK
16.0%
SINGLE FATHER POVERTY
83.1/ 100
METRIC RATING
143rd/ 347
METRIC RANK
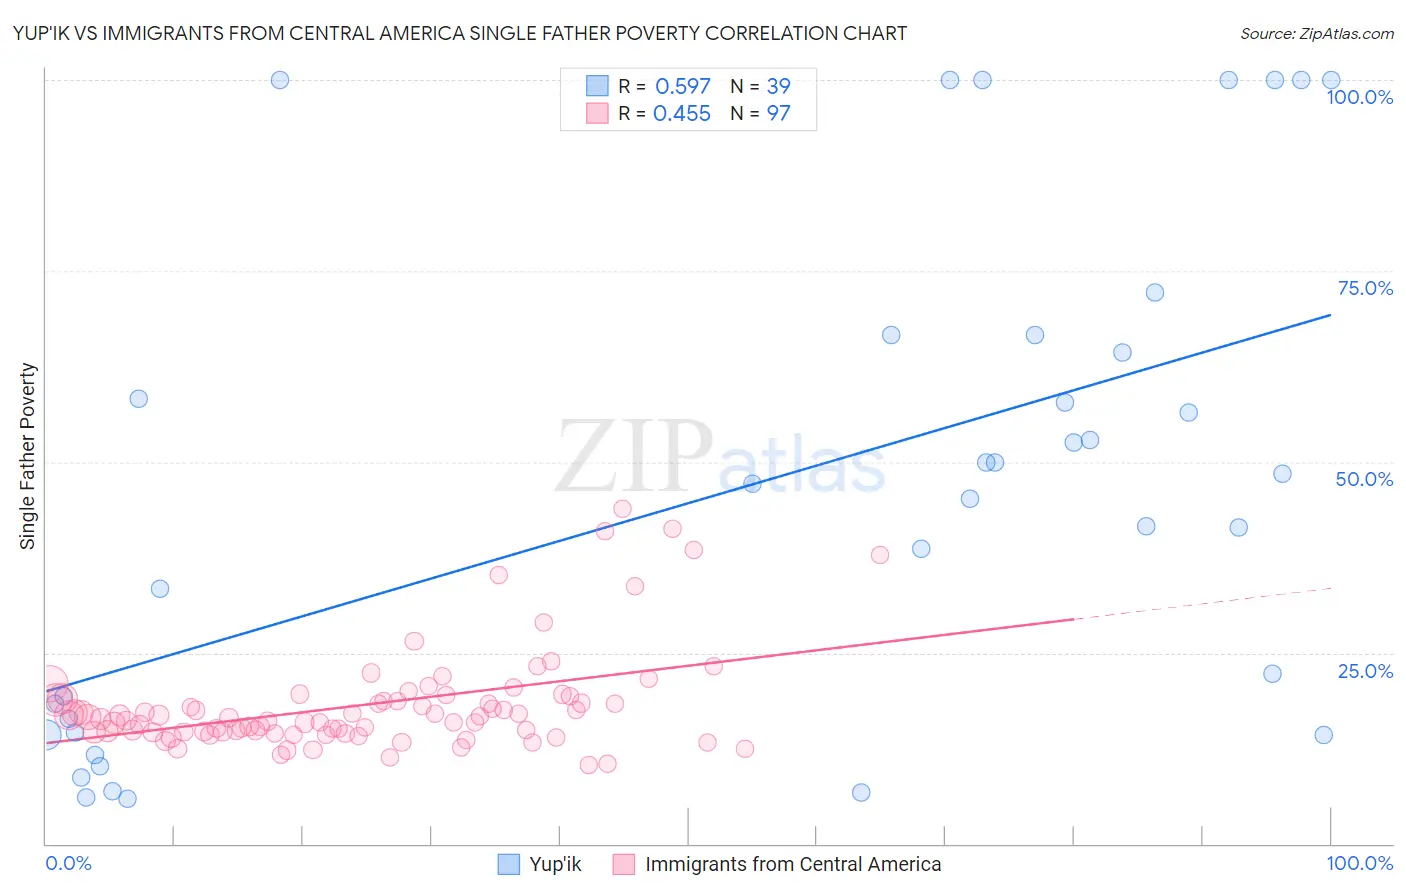
Yup'ik vs Immigrants from Central America Single Father Poverty Correlation Chart
The statistical analysis conducted on geographies consisting of 37,532,100 people shows a substantial positive correlation between the proportion of Yup'ik and poverty level among single fathers in the United States with a correlation coefficient (R) of 0.597 and weighted average of 32.5%. Similarly, the statistical analysis conducted on geographies consisting of 395,620,189 people shows a moderate positive correlation between the proportion of Immigrants from Central America and poverty level among single fathers in the United States with a correlation coefficient (R) of 0.455 and weighted average of 16.0%, a difference of 103.2%.
Single Father Poverty Correlation Summary
| Measurement | Yup'ik | Immigrants from Central America |
| Minimum | 5.9% | 10.4% |
| Maximum | 100.0% | 43.8% |
| Range | 94.1% | 33.4% |
| Mean | 46.6% | 18.2% |
| Median | 47.1% | 16.5% |
| Interquartile 25% (IQ1) | 14.6% | 14.6% |
| Interquartile 75% (IQ3) | 66.7% | 18.9% |
| Interquartile Range (IQR) | 52.0% | 4.3% |
| Standard Deviation (Sample) | 32.1% | 6.7% |
| Standard Deviation (Population) | 31.7% | 6.6% |
Similar Demographics by Single Father Poverty
Demographics Similar to Yup'ik by Single Father Poverty
In terms of single father poverty, the demographic groups most similar to Yup'ik are Puerto Rican (31.5%, a difference of 3.2%), Crow (30.3%, a difference of 7.4%), Navajo (29.2%, a difference of 11.3%), Lumbee (28.5%, a difference of 14.2%), and Yuman (28.4%, a difference of 14.6%).
| Demographics | Rating | Rank | Single Father Poverty |
| Natives/Alaskans | 0.0 /100 | #333 | Tragic 22.4% |
| Kiowa | 0.0 /100 | #334 | Tragic 22.5% |
| Shoshone | 0.0 /100 | #335 | Tragic 22.9% |
| Cajuns | 0.0 /100 | #336 | Tragic 23.1% |
| Sioux | 0.0 /100 | #337 | Tragic 23.9% |
| Arapaho | 0.0 /100 | #338 | Tragic 24.0% |
| Apache | 0.0 /100 | #339 | Tragic 24.2% |
| Houma | 0.0 /100 | #340 | Tragic 26.7% |
| Hopi | 0.0 /100 | #341 | Tragic 27.2% |
| Yuman | 0.0 /100 | #342 | Tragic 28.4% |
| Lumbee | 0.0 /100 | #343 | Tragic 28.5% |
| Navajo | 0.0 /100 | #344 | Tragic 29.2% |
| Crow | 0.0 /100 | #345 | Tragic 30.3% |
| Puerto Ricans | 0.0 /100 | #346 | Tragic 31.5% |
| Yup'ik | 0.0 /100 | #347 | Tragic 32.5% |
Demographics Similar to Immigrants from Central America by Single Father Poverty
In terms of single father poverty, the demographic groups most similar to Immigrants from Central America are Liberian (16.0%, a difference of 0.020%), Immigrants from Mexico (16.0%, a difference of 0.020%), Immigrants from Kuwait (16.0%, a difference of 0.13%), Immigrants from Western Asia (16.0%, a difference of 0.18%), and Immigrants from Netherlands (16.0%, a difference of 0.19%).
| Demographics | Rating | Rank | Single Father Poverty |
| Cypriots | 87.5 /100 | #136 | Excellent 15.9% |
| Immigrants | Azores | 87.2 /100 | #137 | Excellent 15.9% |
| Central Americans | 87.1 /100 | #138 | Excellent 16.0% |
| South Americans | 85.9 /100 | #139 | Excellent 16.0% |
| Immigrants | Netherlands | 85.3 /100 | #140 | Excellent 16.0% |
| Liberians | 83.3 /100 | #141 | Excellent 16.0% |
| Immigrants | Mexico | 83.3 /100 | #142 | Excellent 16.0% |
| Immigrants | Central America | 83.1 /100 | #143 | Excellent 16.0% |
| Immigrants | Kuwait | 81.4 /100 | #144 | Excellent 16.0% |
| Immigrants | Western Asia | 80.7 /100 | #145 | Excellent 16.0% |
| Immigrants | Hungary | 78.3 /100 | #146 | Good 16.1% |
| Colombians | 77.1 /100 | #147 | Good 16.1% |
| Nigerians | 76.8 /100 | #148 | Good 16.1% |
| South Africans | 75.1 /100 | #149 | Good 16.1% |
| Jordanians | 74.2 /100 | #150 | Good 16.1% |