Immigrants from Congo vs Immigrants from Austria Single Father Poverty
COMPARE
Immigrants from Congo
Immigrants from Austria
Single Father Poverty
Single Father Poverty Comparison
Immigrants from Congo
Immigrants from Austria
15.4%
SINGLE FATHER POVERTY
99.4/ 100
METRIC RATING
81st/ 347
METRIC RANK
16.8%
SINGLE FATHER POVERTY
7.0/ 100
METRIC RATING
223rd/ 347
METRIC RANK
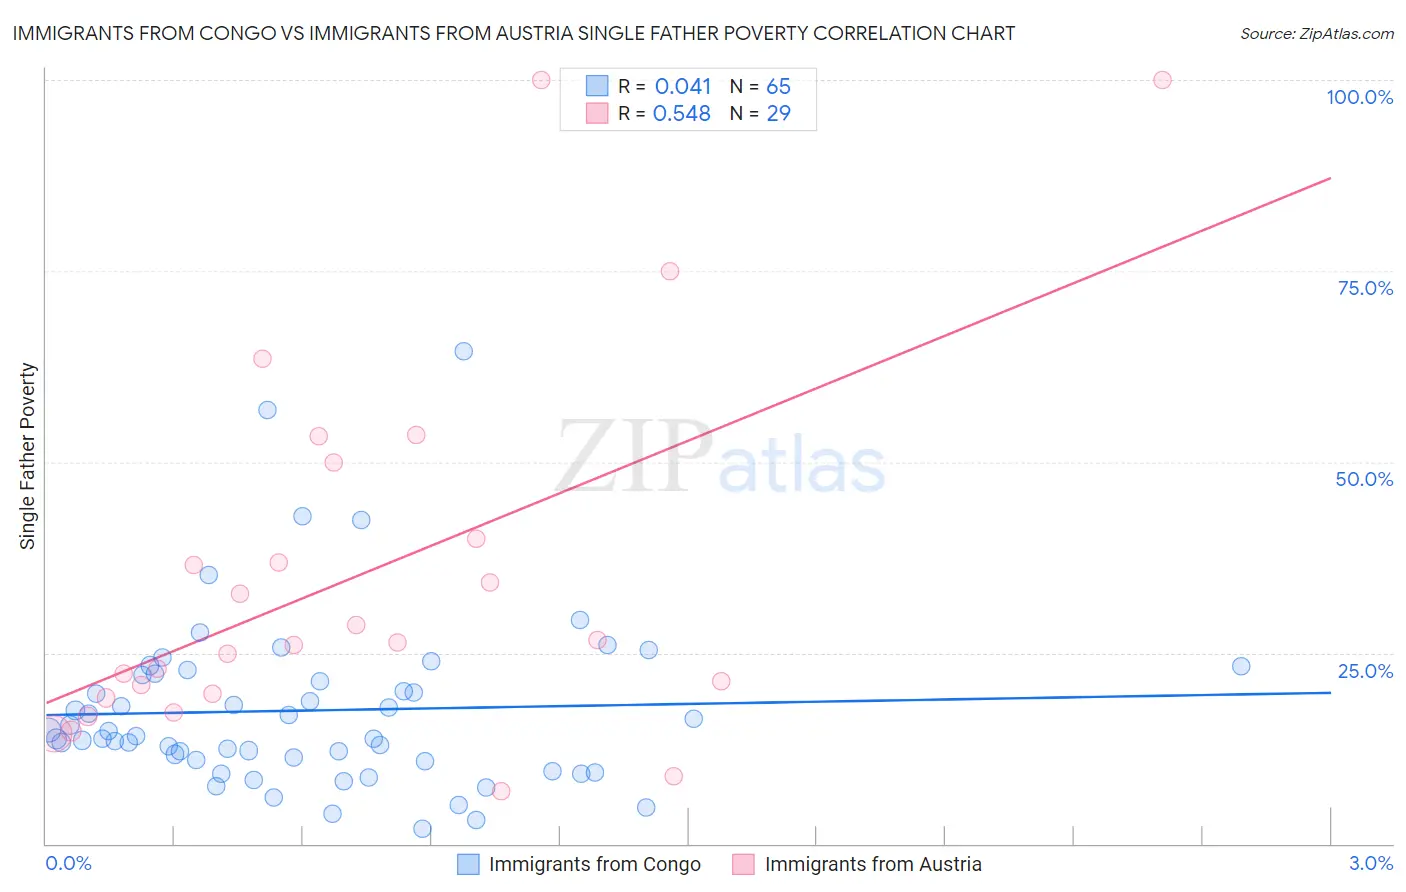
Immigrants from Congo vs Immigrants from Austria Single Father Poverty Correlation Chart
The statistical analysis conducted on geographies consisting of 86,642,680 people shows no correlation between the proportion of Immigrants from Congo and poverty level among single fathers in the United States with a correlation coefficient (R) of 0.041 and weighted average of 15.4%. Similarly, the statistical analysis conducted on geographies consisting of 142,014,739 people shows a substantial positive correlation between the proportion of Immigrants from Austria and poverty level among single fathers in the United States with a correlation coefficient (R) of 0.548 and weighted average of 16.8%, a difference of 8.9%.
Single Father Poverty Correlation Summary
| Measurement | Immigrants from Congo | Immigrants from Austria |
| Minimum | 2.0% | 6.9% |
| Maximum | 64.6% | 100.0% |
| Range | 62.6% | 93.1% |
| Mean | 17.4% | 34.9% |
| Median | 14.1% | 26.3% |
| Interquartile 25% (IQ1) | 10.9% | 19.4% |
| Interquartile 75% (IQ3) | 22.2% | 45.0% |
| Interquartile Range (IQR) | 11.2% | 25.6% |
| Standard Deviation (Sample) | 11.4% | 24.1% |
| Standard Deviation (Population) | 11.3% | 23.7% |
Similar Demographics by Single Father Poverty
Demographics Similar to Immigrants from Congo by Single Father Poverty
In terms of single father poverty, the demographic groups most similar to Immigrants from Congo are Immigrants from Ukraine (15.4%, a difference of 0.010%), Armenian (15.4%, a difference of 0.020%), Chinese (15.4%, a difference of 0.10%), Peruvian (15.4%, a difference of 0.24%), and Immigrants from Northern Africa (15.3%, a difference of 0.25%).
| Demographics | Rating | Rank | Single Father Poverty |
| Maltese | 99.6 /100 | #74 | Exceptional 15.3% |
| Immigrants | Turkey | 99.5 /100 | #75 | Exceptional 15.3% |
| Immigrants | Japan | 99.5 /100 | #76 | Exceptional 15.3% |
| Immigrants | Peru | 99.5 /100 | #77 | Exceptional 15.3% |
| Tlingit-Haida | 99.5 /100 | #78 | Exceptional 15.3% |
| Immigrants | Northern Africa | 99.5 /100 | #79 | Exceptional 15.3% |
| Armenians | 99.4 /100 | #80 | Exceptional 15.4% |
| Immigrants | Congo | 99.4 /100 | #81 | Exceptional 15.4% |
| Immigrants | Ukraine | 99.4 /100 | #82 | Exceptional 15.4% |
| Chinese | 99.3 /100 | #83 | Exceptional 15.4% |
| Peruvians | 99.2 /100 | #84 | Exceptional 15.4% |
| Immigrants | Oceania | 99.1 /100 | #85 | Exceptional 15.4% |
| Immigrants | Russia | 99.0 /100 | #86 | Exceptional 15.5% |
| Brazilians | 99.0 /100 | #87 | Exceptional 15.5% |
| Burmese | 99.0 /100 | #88 | Exceptional 15.5% |
Demographics Similar to Immigrants from Austria by Single Father Poverty
In terms of single father poverty, the demographic groups most similar to Immigrants from Austria are Immigrants from Norway (16.8%, a difference of 0.080%), Menominee (16.8%, a difference of 0.10%), Hispanic or Latino (16.8%, a difference of 0.15%), Immigrants from Spain (16.7%, a difference of 0.16%), and Immigrants from Denmark (16.7%, a difference of 0.17%).
| Demographics | Rating | Rank | Single Father Poverty |
| Immigrants | England | 9.5 /100 | #216 | Tragic 16.7% |
| Cheyenne | 9.3 /100 | #217 | Tragic 16.7% |
| Immigrants | Uganda | 8.6 /100 | #218 | Tragic 16.7% |
| Immigrants | Ghana | 8.1 /100 | #219 | Tragic 16.7% |
| Immigrants | Denmark | 8.1 /100 | #220 | Tragic 16.7% |
| Immigrants | Greece | 8.1 /100 | #221 | Tragic 16.7% |
| Immigrants | Spain | 8.0 /100 | #222 | Tragic 16.7% |
| Immigrants | Austria | 7.0 /100 | #223 | Tragic 16.8% |
| Immigrants | Norway | 6.5 /100 | #224 | Tragic 16.8% |
| Menominee | 6.4 /100 | #225 | Tragic 16.8% |
| Hispanics or Latinos | 6.1 /100 | #226 | Tragic 16.8% |
| British | 5.6 /100 | #227 | Tragic 16.8% |
| Belgians | 5.3 /100 | #228 | Tragic 16.8% |
| Israelis | 4.6 /100 | #229 | Tragic 16.8% |
| Immigrants | Trinidad and Tobago | 4.5 /100 | #230 | Tragic 16.8% |