Immigrants vs Immigrants from Austria Single Father Poverty
COMPARE
Immigrants
Immigrants from Austria
Single Father Poverty
Single Father Poverty Comparison
Immigrants
Immigrants from Austria
15.9%
SINGLE FATHER POVERTY
91.9/ 100
METRIC RATING
121st/ 347
METRIC RANK
16.8%
SINGLE FATHER POVERTY
7.0/ 100
METRIC RATING
223rd/ 347
METRIC RANK
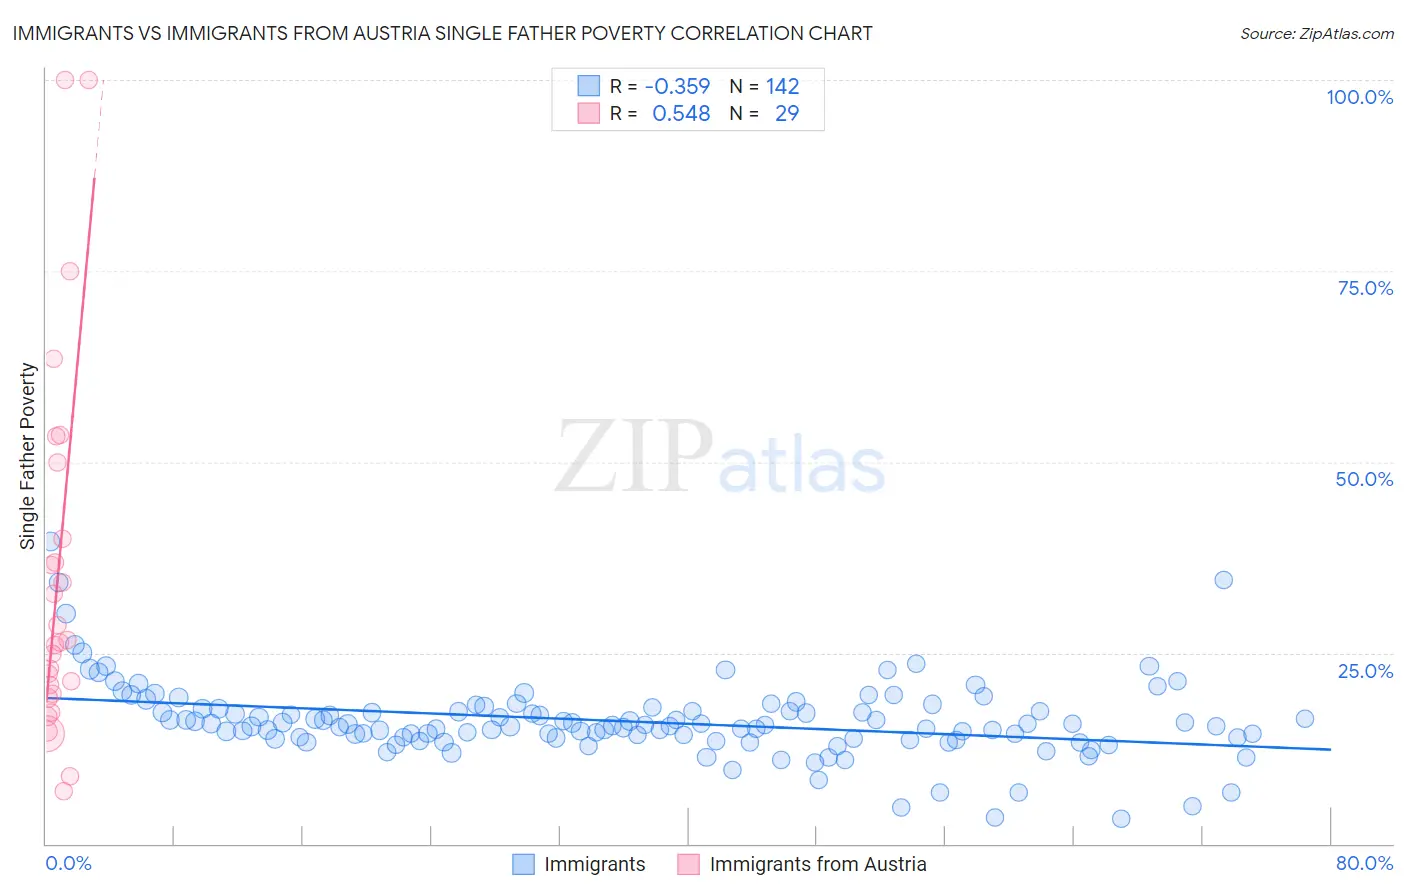
Immigrants vs Immigrants from Austria Single Father Poverty Correlation Chart
The statistical analysis conducted on geographies consisting of 413,041,204 people shows a mild negative correlation between the proportion of Immigrants and poverty level among single fathers in the United States with a correlation coefficient (R) of -0.359 and weighted average of 15.9%. Similarly, the statistical analysis conducted on geographies consisting of 142,014,739 people shows a substantial positive correlation between the proportion of Immigrants from Austria and poverty level among single fathers in the United States with a correlation coefficient (R) of 0.548 and weighted average of 16.8%, a difference of 5.7%.
Single Father Poverty Correlation Summary
| Measurement | Immigrants | Immigrants from Austria |
| Minimum | 3.3% | 6.9% |
| Maximum | 39.5% | 100.0% |
| Range | 36.3% | 93.1% |
| Mean | 16.0% | 34.9% |
| Median | 15.5% | 26.3% |
| Interquartile 25% (IQ1) | 13.9% | 19.4% |
| Interquartile 75% (IQ3) | 17.6% | 45.0% |
| Interquartile Range (IQR) | 3.8% | 25.6% |
| Standard Deviation (Sample) | 5.0% | 24.1% |
| Standard Deviation (Population) | 5.0% | 23.7% |
Similar Demographics by Single Father Poverty
Demographics Similar to Immigrants by Single Father Poverty
In terms of single father poverty, the demographic groups most similar to Immigrants are Uruguayan (15.9%, a difference of 0.020%), Sudanese (15.9%, a difference of 0.060%), Immigrants from Belarus (15.8%, a difference of 0.080%), Immigrants from Eastern Europe (15.8%, a difference of 0.090%), and Palestinian (15.9%, a difference of 0.10%).
| Demographics | Rating | Rank | Single Father Poverty |
| Argentineans | 94.4 /100 | #114 | Exceptional 15.8% |
| Immigrants | Thailand | 93.6 /100 | #115 | Exceptional 15.8% |
| Immigrants | Argentina | 92.8 /100 | #116 | Exceptional 15.8% |
| Immigrants | Colombia | 92.6 /100 | #117 | Exceptional 15.8% |
| Immigrants | Eastern Europe | 92.5 /100 | #118 | Exceptional 15.8% |
| Immigrants | Belarus | 92.4 /100 | #119 | Exceptional 15.8% |
| Uruguayans | 92.1 /100 | #120 | Exceptional 15.9% |
| Immigrants | Immigrants | 91.9 /100 | #121 | Exceptional 15.9% |
| Sudanese | 91.6 /100 | #122 | Exceptional 15.9% |
| Palestinians | 91.3 /100 | #123 | Exceptional 15.9% |
| Immigrants | Panama | 91.3 /100 | #124 | Exceptional 15.9% |
| Iraqis | 91.2 /100 | #125 | Exceptional 15.9% |
| Hmong | 91.1 /100 | #126 | Exceptional 15.9% |
| Immigrants | Liberia | 91.1 /100 | #127 | Exceptional 15.9% |
| Immigrants | Nigeria | 90.8 /100 | #128 | Exceptional 15.9% |
Demographics Similar to Immigrants from Austria by Single Father Poverty
In terms of single father poverty, the demographic groups most similar to Immigrants from Austria are Immigrants from Norway (16.8%, a difference of 0.080%), Menominee (16.8%, a difference of 0.10%), Hispanic or Latino (16.8%, a difference of 0.15%), Immigrants from Spain (16.7%, a difference of 0.16%), and Immigrants from Denmark (16.7%, a difference of 0.17%).
| Demographics | Rating | Rank | Single Father Poverty |
| Immigrants | England | 9.5 /100 | #216 | Tragic 16.7% |
| Cheyenne | 9.3 /100 | #217 | Tragic 16.7% |
| Immigrants | Uganda | 8.6 /100 | #218 | Tragic 16.7% |
| Immigrants | Ghana | 8.1 /100 | #219 | Tragic 16.7% |
| Immigrants | Denmark | 8.1 /100 | #220 | Tragic 16.7% |
| Immigrants | Greece | 8.1 /100 | #221 | Tragic 16.7% |
| Immigrants | Spain | 8.0 /100 | #222 | Tragic 16.7% |
| Immigrants | Austria | 7.0 /100 | #223 | Tragic 16.8% |
| Immigrants | Norway | 6.5 /100 | #224 | Tragic 16.8% |
| Menominee | 6.4 /100 | #225 | Tragic 16.8% |
| Hispanics or Latinos | 6.1 /100 | #226 | Tragic 16.8% |
| British | 5.6 /100 | #227 | Tragic 16.8% |
| Belgians | 5.3 /100 | #228 | Tragic 16.8% |
| Israelis | 4.6 /100 | #229 | Tragic 16.8% |
| Immigrants | Trinidad and Tobago | 4.5 /100 | #230 | Tragic 16.8% |