Kenyan vs Immigrants from Austria Single Father Poverty
COMPARE
Kenyan
Immigrants from Austria
Single Father Poverty
Single Father Poverty Comparison
Kenyans
Immigrants from Austria
15.3%
SINGLE FATHER POVERTY
99.6/ 100
METRIC RATING
73rd/ 347
METRIC RANK
16.8%
SINGLE FATHER POVERTY
7.0/ 100
METRIC RATING
223rd/ 347
METRIC RANK
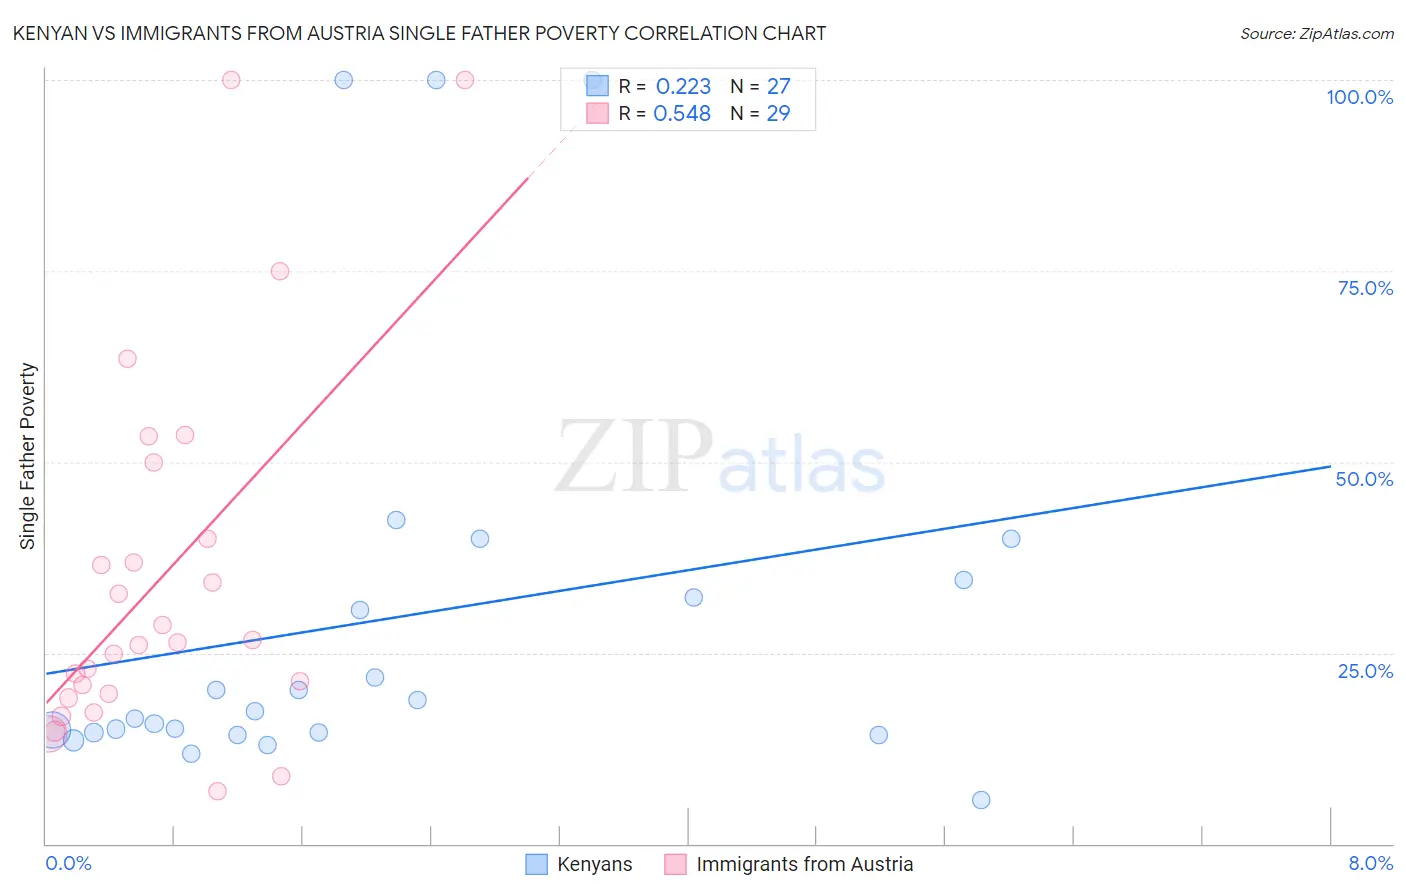
Kenyan vs Immigrants from Austria Single Father Poverty Correlation Chart
The statistical analysis conducted on geographies consisting of 147,839,292 people shows a weak positive correlation between the proportion of Kenyans and poverty level among single fathers in the United States with a correlation coefficient (R) of 0.223 and weighted average of 15.3%. Similarly, the statistical analysis conducted on geographies consisting of 142,014,739 people shows a substantial positive correlation between the proportion of Immigrants from Austria and poverty level among single fathers in the United States with a correlation coefficient (R) of 0.548 and weighted average of 16.8%, a difference of 9.4%.
Single Father Poverty Correlation Summary
| Measurement | Kenyan | Immigrants from Austria |
| Minimum | 5.7% | 6.9% |
| Maximum | 100.0% | 100.0% |
| Range | 94.3% | 93.1% |
| Mean | 29.5% | 34.9% |
| Median | 17.3% | 26.3% |
| Interquartile 25% (IQ1) | 14.6% | 19.4% |
| Interquartile 75% (IQ3) | 34.6% | 45.0% |
| Interquartile Range (IQR) | 20.0% | 25.6% |
| Standard Deviation (Sample) | 27.1% | 24.1% |
| Standard Deviation (Population) | 26.6% | 23.7% |
Similar Demographics by Single Father Poverty
Demographics Similar to Kenyans by Single Father Poverty
In terms of single father poverty, the demographic groups most similar to Kenyans are Maltese (15.3%, a difference of 0.040%), Immigrants from Turkey (15.3%, a difference of 0.060%), Immigrants from Lithuania (15.3%, a difference of 0.090%), Immigrants from Japan (15.3%, a difference of 0.14%), and Immigrants from Peru (15.3%, a difference of 0.15%).
| Demographics | Rating | Rank | Single Father Poverty |
| Immigrants | Moldova | 99.8 /100 | #66 | Exceptional 15.2% |
| Paraguayans | 99.7 /100 | #67 | Exceptional 15.2% |
| Immigrants | Cameroon | 99.7 /100 | #68 | Exceptional 15.2% |
| Japanese | 99.7 /100 | #69 | Exceptional 15.2% |
| Mongolians | 99.7 /100 | #70 | Exceptional 15.3% |
| Immigrants | Brazil | 99.6 /100 | #71 | Exceptional 15.3% |
| Immigrants | Lithuania | 99.6 /100 | #72 | Exceptional 15.3% |
| Kenyans | 99.6 /100 | #73 | Exceptional 15.3% |
| Maltese | 99.6 /100 | #74 | Exceptional 15.3% |
| Immigrants | Turkey | 99.5 /100 | #75 | Exceptional 15.3% |
| Immigrants | Japan | 99.5 /100 | #76 | Exceptional 15.3% |
| Immigrants | Peru | 99.5 /100 | #77 | Exceptional 15.3% |
| Tlingit-Haida | 99.5 /100 | #78 | Exceptional 15.3% |
| Immigrants | Northern Africa | 99.5 /100 | #79 | Exceptional 15.3% |
| Armenians | 99.4 /100 | #80 | Exceptional 15.4% |
Demographics Similar to Immigrants from Austria by Single Father Poverty
In terms of single father poverty, the demographic groups most similar to Immigrants from Austria are Immigrants from Norway (16.8%, a difference of 0.080%), Menominee (16.8%, a difference of 0.10%), Hispanic or Latino (16.8%, a difference of 0.15%), Immigrants from Spain (16.7%, a difference of 0.16%), and Immigrants from Denmark (16.7%, a difference of 0.17%).
| Demographics | Rating | Rank | Single Father Poverty |
| Immigrants | England | 9.5 /100 | #216 | Tragic 16.7% |
| Cheyenne | 9.3 /100 | #217 | Tragic 16.7% |
| Immigrants | Uganda | 8.6 /100 | #218 | Tragic 16.7% |
| Immigrants | Ghana | 8.1 /100 | #219 | Tragic 16.7% |
| Immigrants | Denmark | 8.1 /100 | #220 | Tragic 16.7% |
| Immigrants | Greece | 8.1 /100 | #221 | Tragic 16.7% |
| Immigrants | Spain | 8.0 /100 | #222 | Tragic 16.7% |
| Immigrants | Austria | 7.0 /100 | #223 | Tragic 16.8% |
| Immigrants | Norway | 6.5 /100 | #224 | Tragic 16.8% |
| Menominee | 6.4 /100 | #225 | Tragic 16.8% |
| Hispanics or Latinos | 6.1 /100 | #226 | Tragic 16.8% |
| British | 5.6 /100 | #227 | Tragic 16.8% |
| Belgians | 5.3 /100 | #228 | Tragic 16.8% |
| Israelis | 4.6 /100 | #229 | Tragic 16.8% |
| Immigrants | Trinidad and Tobago | 4.5 /100 | #230 | Tragic 16.8% |