Yugoslavian vs Central American Indian 4th Grade
COMPARE
Yugoslavian
Central American Indian
4th Grade
4th Grade Comparison
Yugoslavians
Central American Indians
97.9%
4TH GRADE
98.1/ 100
METRIC RATING
100th/ 347
METRIC RANK
96.2%
4TH GRADE
0.0/ 100
METRIC RATING
317th/ 347
METRIC RANK
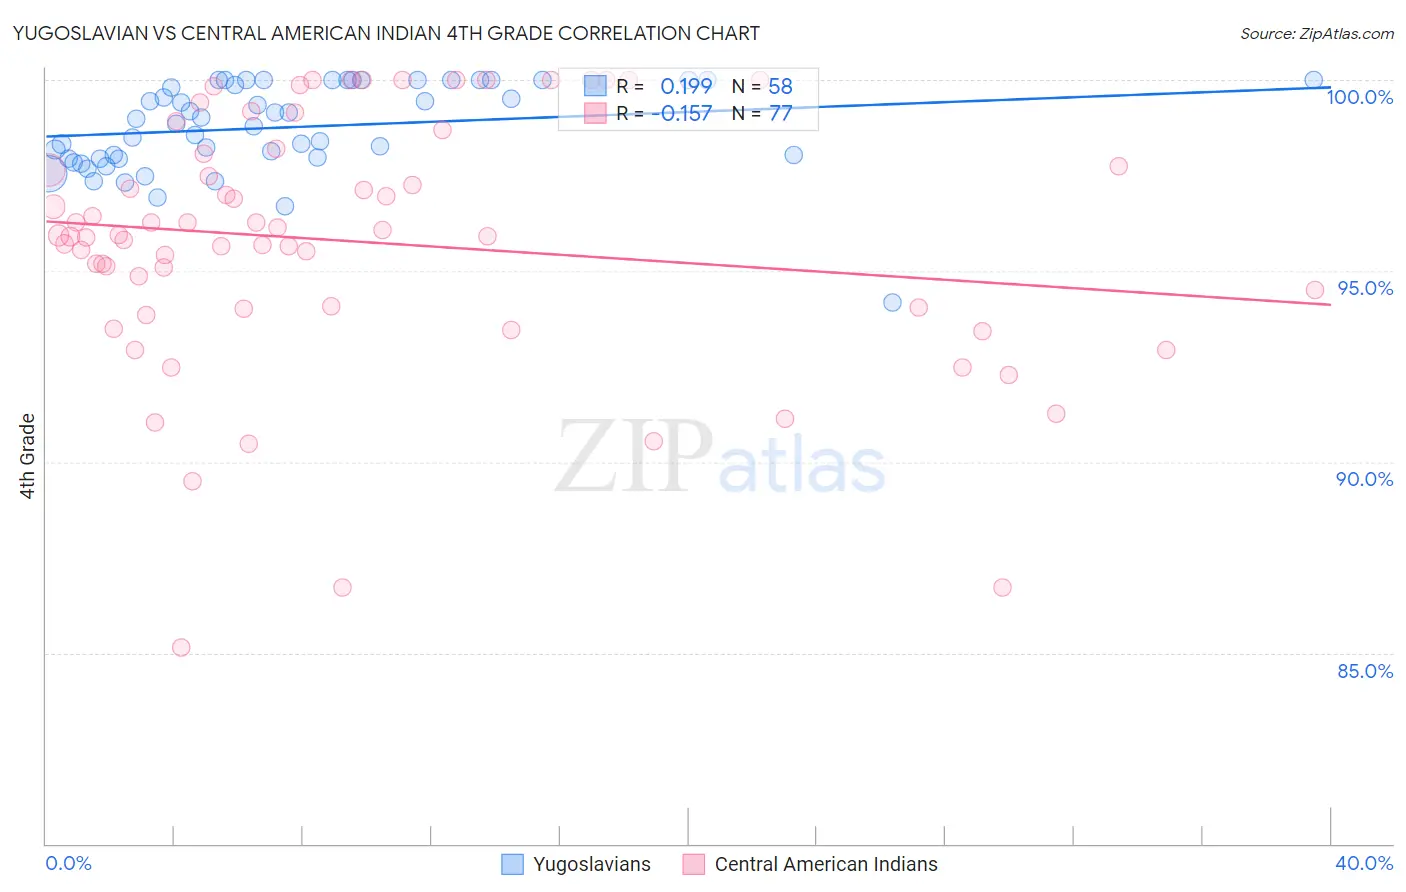
Yugoslavian vs Central American Indian 4th Grade Correlation Chart
The statistical analysis conducted on geographies consisting of 285,618,157 people shows a poor positive correlation between the proportion of Yugoslavians and percentage of population with at least 4th grade education in the United States with a correlation coefficient (R) of 0.199 and weighted average of 97.9%. Similarly, the statistical analysis conducted on geographies consisting of 326,140,921 people shows a poor negative correlation between the proportion of Central American Indians and percentage of population with at least 4th grade education in the United States with a correlation coefficient (R) of -0.157 and weighted average of 96.2%, a difference of 1.8%.
4th Grade Correlation Summary
| Measurement | Yugoslavian | Central American Indian |
| Minimum | 94.2% | 85.1% |
| Maximum | 100.0% | 100.0% |
| Range | 5.8% | 14.9% |
| Mean | 98.8% | 95.8% |
| Median | 98.9% | 95.9% |
| Interquartile 25% (IQ1) | 97.9% | 94.0% |
| Interquartile 75% (IQ3) | 100.0% | 98.1% |
| Interquartile Range (IQR) | 2.1% | 4.1% |
| Standard Deviation (Sample) | 1.2% | 3.3% |
| Standard Deviation (Population) | 1.2% | 3.3% |
Similar Demographics by 4th Grade
Demographics Similar to Yugoslavians by 4th Grade
In terms of 4th grade, the demographic groups most similar to Yugoslavians are Turkish (97.9%, a difference of 0.0%), Cree (97.9%, a difference of 0.0%), Cheyenne (97.9%, a difference of 0.010%), South African (97.9%, a difference of 0.010%), and Choctaw (97.9%, a difference of 0.010%).
| Demographics | Rating | Rank | 4th Grade |
| Immigrants | Ireland | 98.7 /100 | #93 | Exceptional 97.9% |
| Shoshone | 98.7 /100 | #94 | Exceptional 97.9% |
| Immigrants | Germany | 98.5 /100 | #95 | Exceptional 97.9% |
| Romanians | 98.4 /100 | #96 | Exceptional 97.9% |
| Cheyenne | 98.4 /100 | #97 | Exceptional 97.9% |
| South Africans | 98.2 /100 | #98 | Exceptional 97.9% |
| Turks | 98.2 /100 | #99 | Exceptional 97.9% |
| Yugoslavians | 98.1 /100 | #100 | Exceptional 97.9% |
| Cree | 98.1 /100 | #101 | Exceptional 97.9% |
| Choctaw | 97.9 /100 | #102 | Exceptional 97.9% |
| Puget Sound Salish | 97.7 /100 | #103 | Exceptional 97.9% |
| Immigrants | Nonimmigrants | 97.5 /100 | #104 | Exceptional 97.9% |
| German Russians | 97.5 /100 | #105 | Exceptional 97.9% |
| Immigrants | Czechoslovakia | 97.5 /100 | #106 | Exceptional 97.9% |
| Bhutanese | 97.4 /100 | #107 | Exceptional 97.9% |
Demographics Similar to Central American Indians by 4th Grade
In terms of 4th grade, the demographic groups most similar to Central American Indians are Immigrants from Ecuador (96.2%, a difference of 0.040%), Immigrants from the Azores (96.1%, a difference of 0.040%), Vietnamese (96.2%, a difference of 0.050%), Nicaraguan (96.2%, a difference of 0.050%), and Indonesian (96.2%, a difference of 0.060%).
| Demographics | Rating | Rank | 4th Grade |
| Immigrants | Burma/Myanmar | 0.0 /100 | #310 | Tragic 96.3% |
| Immigrants | Bangladesh | 0.0 /100 | #311 | Tragic 96.2% |
| Cape Verdeans | 0.0 /100 | #312 | Tragic 96.2% |
| Indonesians | 0.0 /100 | #313 | Tragic 96.2% |
| Vietnamese | 0.0 /100 | #314 | Tragic 96.2% |
| Nicaraguans | 0.0 /100 | #315 | Tragic 96.2% |
| Immigrants | Ecuador | 0.0 /100 | #316 | Tragic 96.2% |
| Central American Indians | 0.0 /100 | #317 | Tragic 96.2% |
| Immigrants | Azores | 0.0 /100 | #318 | Tragic 96.1% |
| Belizeans | 0.0 /100 | #319 | Tragic 96.1% |
| Bangladeshis | 0.0 /100 | #320 | Tragic 96.1% |
| Japanese | 0.0 /100 | #321 | Tragic 96.0% |
| Immigrants | Vietnam | 0.0 /100 | #322 | Tragic 96.0% |
| Immigrants | Nicaragua | 0.0 /100 | #323 | Tragic 96.0% |
| Immigrants | Belize | 0.0 /100 | #324 | Tragic 96.0% |