Yaqui vs Cypriot Receiving Food Stamps
COMPARE
Yaqui
Cypriot
Receiving Food Stamps
Receiving Food Stamps Comparison
Yaqui
Cypriots
13.9%
RECEIVING FOOD STAMPS
0.5/ 100
METRIC RATING
251st/ 347
METRIC RANK
8.9%
RECEIVING FOOD STAMPS
99.9/ 100
METRIC RATING
12th/ 347
METRIC RANK
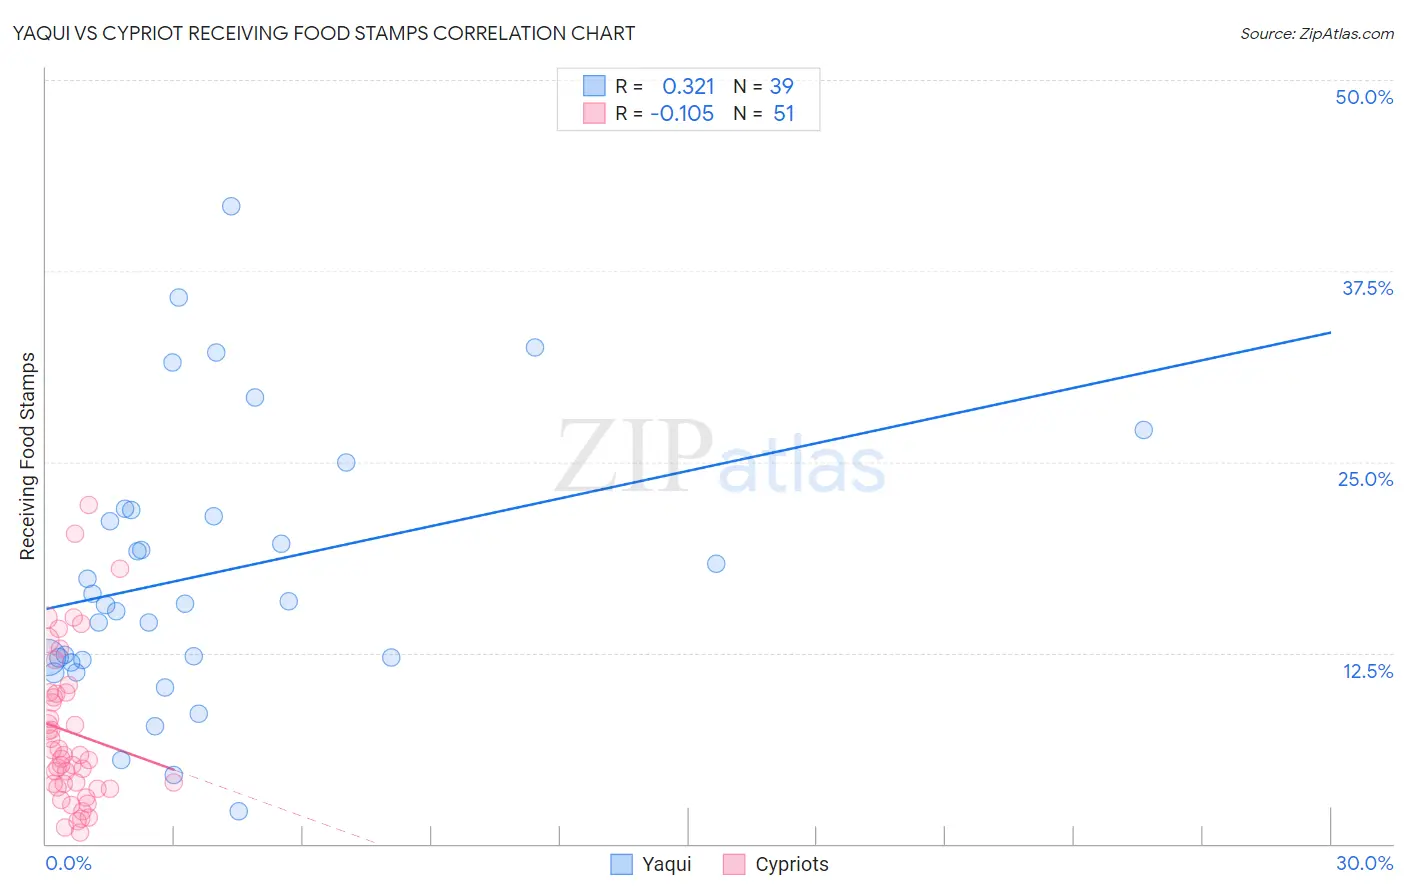
Yaqui vs Cypriot Receiving Food Stamps Correlation Chart
The statistical analysis conducted on geographies consisting of 107,632,766 people shows a mild positive correlation between the proportion of Yaqui and percentage of population receiving government assistance and/or food stamps in the United States with a correlation coefficient (R) of 0.321 and weighted average of 13.9%. Similarly, the statistical analysis conducted on geographies consisting of 61,805,635 people shows a poor negative correlation between the proportion of Cypriots and percentage of population receiving government assistance and/or food stamps in the United States with a correlation coefficient (R) of -0.105 and weighted average of 8.9%, a difference of 56.6%.
Receiving Food Stamps Correlation Summary
| Measurement | Yaqui | Cypriot |
| Minimum | 2.1% | 0.70% |
| Maximum | 41.8% | 22.2% |
| Range | 39.7% | 21.5% |
| Mean | 17.7% | 7.3% |
| Median | 15.7% | 5.8% |
| Interquartile 25% (IQ1) | 12.0% | 3.7% |
| Interquartile 75% (IQ3) | 21.8% | 9.9% |
| Interquartile Range (IQR) | 9.8% | 6.2% |
| Standard Deviation (Sample) | 8.9% | 5.0% |
| Standard Deviation (Population) | 8.8% | 5.0% |
Similar Demographics by Receiving Food Stamps
Demographics Similar to Yaqui by Receiving Food Stamps
In terms of receiving food stamps, the demographic groups most similar to Yaqui are Immigrants from Cambodia (13.9%, a difference of 0.070%), Indonesian (13.9%, a difference of 0.24%), Ghanaian (14.0%, a difference of 0.44%), Spanish American (14.0%, a difference of 0.82%), and Immigrants from Laos (13.8%, a difference of 0.88%).
| Demographics | Rating | Rank | Receiving Food Stamps |
| Cajuns | 0.9 /100 | #244 | Tragic 13.7% |
| Immigrants | Somalia | 0.9 /100 | #245 | Tragic 13.7% |
| Cree | 0.8 /100 | #246 | Tragic 13.7% |
| Mexican American Indians | 0.7 /100 | #247 | Tragic 13.8% |
| Immigrants | Laos | 0.7 /100 | #248 | Tragic 13.8% |
| Indonesians | 0.6 /100 | #249 | Tragic 13.9% |
| Immigrants | Cambodia | 0.5 /100 | #250 | Tragic 13.9% |
| Yaqui | 0.5 /100 | #251 | Tragic 13.9% |
| Ghanaians | 0.5 /100 | #252 | Tragic 14.0% |
| Spanish Americans | 0.4 /100 | #253 | Tragic 14.0% |
| Marshallese | 0.3 /100 | #254 | Tragic 14.1% |
| Sub-Saharan Africans | 0.3 /100 | #255 | Tragic 14.1% |
| Japanese | 0.3 /100 | #256 | Tragic 14.1% |
| Arapaho | 0.3 /100 | #257 | Tragic 14.1% |
| Immigrants | Ghana | 0.3 /100 | #258 | Tragic 14.1% |
Demographics Similar to Cypriots by Receiving Food Stamps
In terms of receiving food stamps, the demographic groups most similar to Cypriots are Okinawan (8.9%, a difference of 0.010%), Bulgarian (8.9%, a difference of 0.19%), Maltese (8.9%, a difference of 0.33%), Immigrants from South Central Asia (8.8%, a difference of 0.44%), and Norwegian (9.0%, a difference of 0.99%).
| Demographics | Rating | Rank | Receiving Food Stamps |
| Thais | 100.0 /100 | #5 | Exceptional 8.1% |
| Immigrants | Singapore | 100.0 /100 | #6 | Exceptional 8.3% |
| Immigrants | Iran | 100.0 /100 | #7 | Exceptional 8.3% |
| Burmese | 99.9 /100 | #8 | Exceptional 8.6% |
| Immigrants | Korea | 99.9 /100 | #9 | Exceptional 8.7% |
| Immigrants | South Central Asia | 99.9 /100 | #10 | Exceptional 8.8% |
| Okinawans | 99.9 /100 | #11 | Exceptional 8.9% |
| Cypriots | 99.9 /100 | #12 | Exceptional 8.9% |
| Bulgarians | 99.9 /100 | #13 | Exceptional 8.9% |
| Maltese | 99.9 /100 | #14 | Exceptional 8.9% |
| Norwegians | 99.9 /100 | #15 | Exceptional 9.0% |
| Immigrants | Japan | 99.9 /100 | #16 | Exceptional 9.0% |
| Immigrants | Scotland | 99.9 /100 | #17 | Exceptional 9.0% |
| Danes | 99.9 /100 | #18 | Exceptional 9.0% |
| Immigrants | Hong Kong | 99.8 /100 | #19 | Exceptional 9.1% |