Yaqui vs Immigrants from Denmark Single Father Households
COMPARE
Yaqui
Immigrants from Denmark
Single Father Households
Single Father Households Comparison
Yaqui
Immigrants from Denmark
3.2%
SINGLE FATHER HOUSEHOLDS
0.0/ 100
METRIC RATING
332nd/ 347
METRIC RANK
2.1%
SINGLE FATHER HOUSEHOLDS
99.8/ 100
METRIC RATING
68th/ 347
METRIC RANK
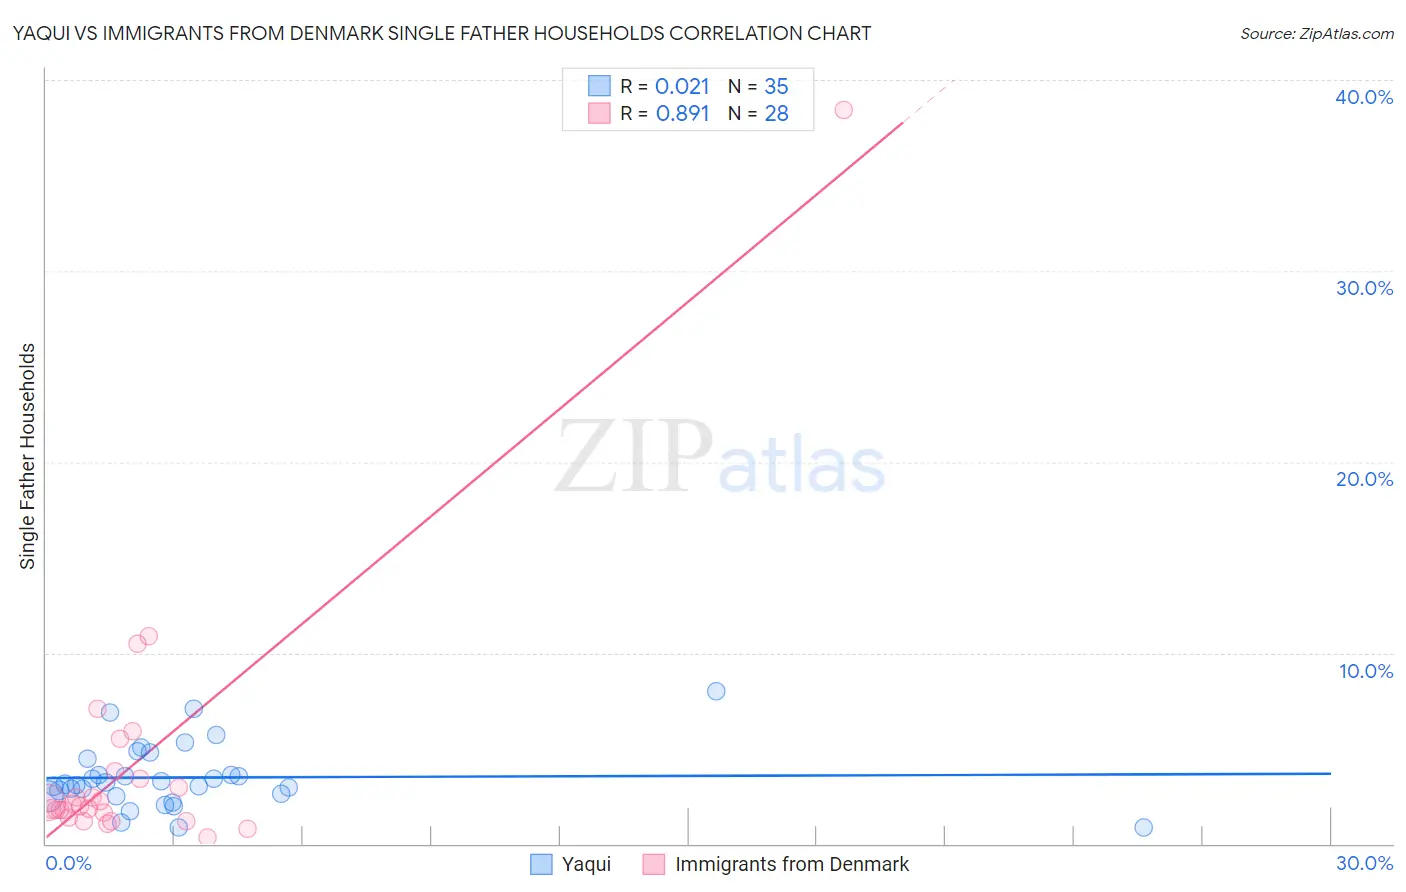
Yaqui vs Immigrants from Denmark Single Father Households Correlation Chart
The statistical analysis conducted on geographies consisting of 107,422,913 people shows no correlation between the proportion of Yaqui and percentage of single father households in the United States with a correlation coefficient (R) of 0.021 and weighted average of 3.2%. Similarly, the statistical analysis conducted on geographies consisting of 135,813,845 people shows a very strong positive correlation between the proportion of Immigrants from Denmark and percentage of single father households in the United States with a correlation coefficient (R) of 0.891 and weighted average of 2.1%, a difference of 54.7%.
Single Father Households Correlation Summary
| Measurement | Yaqui | Immigrants from Denmark |
| Minimum | 0.87% | 0.35% |
| Maximum | 8.0% | 38.5% |
| Range | 7.1% | 38.1% |
| Mean | 3.5% | 4.3% |
| Median | 3.1% | 2.0% |
| Interquartile 25% (IQ1) | 2.5% | 1.5% |
| Interquartile 75% (IQ3) | 4.5% | 3.6% |
| Interquartile Range (IQR) | 2.0% | 2.1% |
| Standard Deviation (Sample) | 1.7% | 7.2% |
| Standard Deviation (Population) | 1.6% | 7.1% |
Similar Demographics by Single Father Households
Demographics Similar to Yaqui by Single Father Households
In terms of single father households, the demographic groups most similar to Yaqui are Navajo (3.2%, a difference of 0.040%), Native/Alaskan (3.2%, a difference of 0.49%), Nepalese (3.1%, a difference of 2.3%), Chippewa (3.1%, a difference of 3.2%), and Yuman (3.3%, a difference of 3.3%).
| Demographics | Rating | Rank | Single Father Households |
| Immigrants | Mexico | 0.0 /100 | #325 | Tragic 3.0% |
| Aleuts | 0.0 /100 | #326 | Tragic 3.0% |
| Bangladeshis | 0.0 /100 | #327 | Tragic 3.1% |
| Immigrants | Cabo Verde | 0.0 /100 | #328 | Tragic 3.1% |
| Chippewa | 0.0 /100 | #329 | Tragic 3.1% |
| Nepalese | 0.0 /100 | #330 | Tragic 3.1% |
| Navajo | 0.0 /100 | #331 | Tragic 3.2% |
| Yaqui | 0.0 /100 | #332 | Tragic 3.2% |
| Natives/Alaskans | 0.0 /100 | #333 | Tragic 3.2% |
| Yuman | 0.0 /100 | #334 | Tragic 3.3% |
| Colville | 0.0 /100 | #335 | Tragic 3.3% |
| Paiute | 0.0 /100 | #336 | Tragic 3.3% |
| Pueblo | 0.0 /100 | #337 | Tragic 3.3% |
| Sioux | 0.0 /100 | #338 | Tragic 3.3% |
| Alaskan Athabascans | 0.0 /100 | #339 | Tragic 3.4% |
Demographics Similar to Immigrants from Denmark by Single Father Households
In terms of single father households, the demographic groups most similar to Immigrants from Denmark are Immigrants from Romania (2.1%, a difference of 0.020%), Immigrants from Italy (2.1%, a difference of 0.090%), Immigrants from Western Asia (2.1%, a difference of 0.14%), Egyptian (2.1%, a difference of 0.23%), and Immigrants from Kuwait (2.1%, a difference of 0.24%).
| Demographics | Rating | Rank | Single Father Households |
| Vietnamese | 99.9 /100 | #61 | Exceptional 2.0% |
| Immigrants | Malaysia | 99.9 /100 | #62 | Exceptional 2.0% |
| Maltese | 99.9 /100 | #63 | Exceptional 2.0% |
| Mongolians | 99.9 /100 | #64 | Exceptional 2.1% |
| Paraguayans | 99.9 /100 | #65 | Exceptional 2.1% |
| Immigrants | Western Asia | 99.8 /100 | #66 | Exceptional 2.1% |
| Immigrants | Italy | 99.8 /100 | #67 | Exceptional 2.1% |
| Immigrants | Denmark | 99.8 /100 | #68 | Exceptional 2.1% |
| Immigrants | Romania | 99.8 /100 | #69 | Exceptional 2.1% |
| Egyptians | 99.8 /100 | #70 | Exceptional 2.1% |
| Immigrants | Kuwait | 99.8 /100 | #71 | Exceptional 2.1% |
| Immigrants | Spain | 99.8 /100 | #72 | Exceptional 2.1% |
| Immigrants | Bangladesh | 99.8 /100 | #73 | Exceptional 2.1% |
| Immigrants | Egypt | 99.8 /100 | #74 | Exceptional 2.1% |
| Immigrants | Sweden | 99.8 /100 | #75 | Exceptional 2.1% |