Yakama vs Syrian Female Poverty
COMPARE
Yakama
Syrian
Female Poverty
Female Poverty Comparison
Yakama
Syrians
18.0%
FEMALE POVERTY
0.0/ 100
METRIC RATING
327th/ 347
METRIC RANK
13.0%
FEMALE POVERTY
79.6/ 100
METRIC RATING
145th/ 347
METRIC RANK
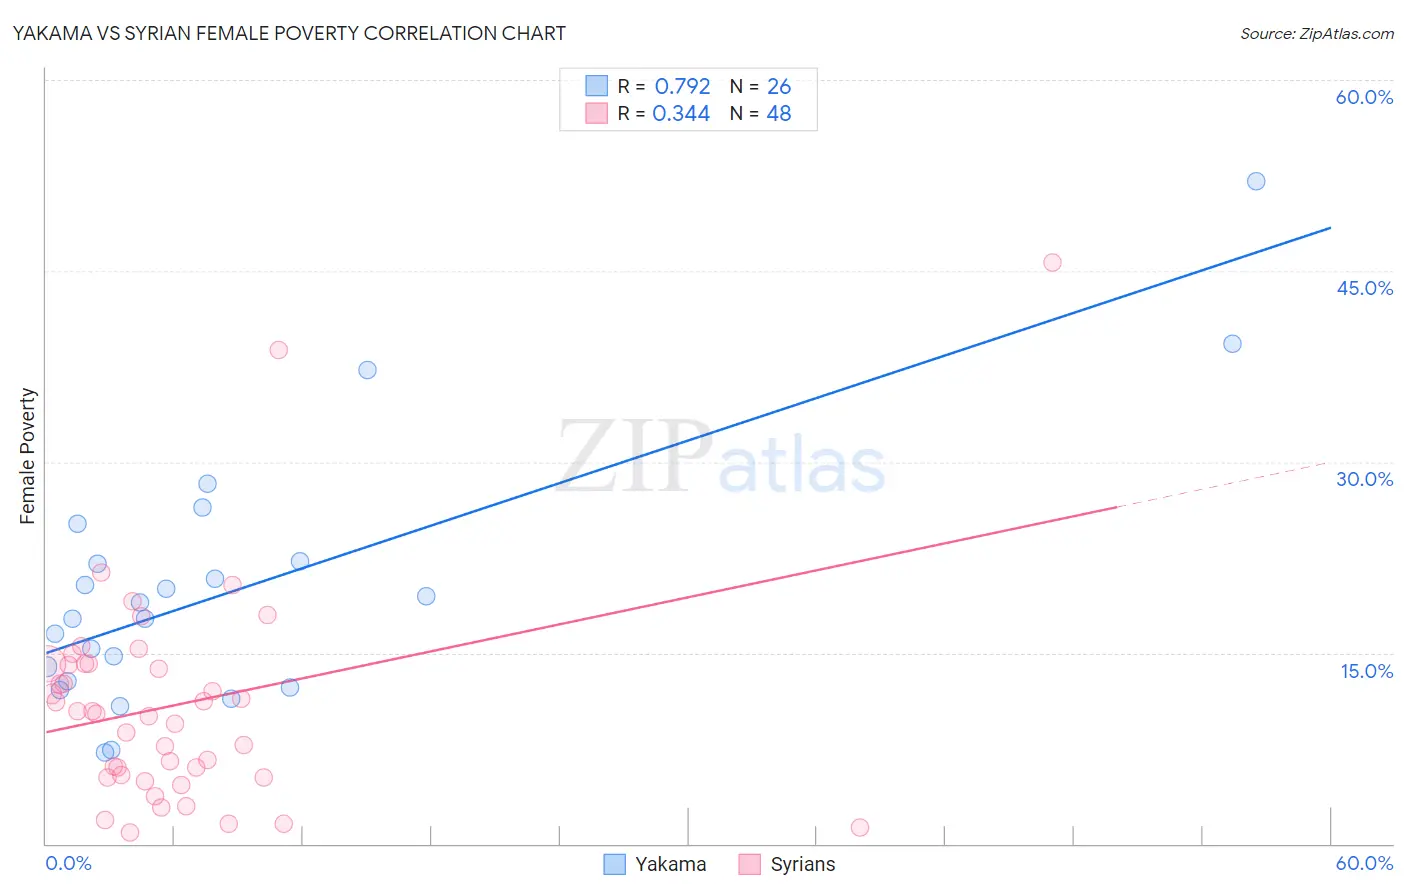
Yakama vs Syrian Female Poverty Correlation Chart
The statistical analysis conducted on geographies consisting of 19,917,707 people shows a strong positive correlation between the proportion of Yakama and poverty level among females in the United States with a correlation coefficient (R) of 0.792 and weighted average of 18.0%. Similarly, the statistical analysis conducted on geographies consisting of 266,159,377 people shows a mild positive correlation between the proportion of Syrians and poverty level among females in the United States with a correlation coefficient (R) of 0.344 and weighted average of 13.0%, a difference of 38.8%.
Female Poverty Correlation Summary
| Measurement | Yakama | Syrian |
| Minimum | 7.1% | 0.87% |
| Maximum | 52.1% | 45.6% |
| Range | 44.9% | 44.7% |
| Mean | 20.1% | 11.0% |
| Median | 18.4% | 10.3% |
| Interquartile 25% (IQ1) | 12.8% | 5.3% |
| Interquartile 75% (IQ3) | 22.2% | 14.1% |
| Interquartile Range (IQR) | 9.5% | 8.8% |
| Standard Deviation (Sample) | 10.2% | 8.5% |
| Standard Deviation (Population) | 10.0% | 8.4% |
Similar Demographics by Female Poverty
Demographics Similar to Yakama by Female Poverty
In terms of female poverty, the demographic groups most similar to Yakama are Central American Indian (18.0%, a difference of 0.10%), Colville (17.8%, a difference of 1.6%), Immigrants from Honduras (17.7%, a difference of 1.8%), Paiute (17.7%, a difference of 2.0%), and Menominee (17.6%, a difference of 2.6%).
| Demographics | Rating | Rank | Female Poverty |
| Immigrants | Dominica | 0.0 /100 | #320 | Tragic 17.5% |
| Arapaho | 0.0 /100 | #321 | Tragic 17.5% |
| Menominee | 0.0 /100 | #322 | Tragic 17.6% |
| Paiute | 0.0 /100 | #323 | Tragic 17.7% |
| Immigrants | Honduras | 0.0 /100 | #324 | Tragic 17.7% |
| Colville | 0.0 /100 | #325 | Tragic 17.8% |
| Central American Indians | 0.0 /100 | #326 | Tragic 18.0% |
| Yakama | 0.0 /100 | #327 | Tragic 18.0% |
| Blacks/African Americans | 0.0 /100 | #328 | Tragic 18.6% |
| Kiowa | 0.0 /100 | #329 | Tragic 18.6% |
| Dominicans | 0.0 /100 | #330 | Tragic 19.1% |
| Natives/Alaskans | 0.0 /100 | #331 | Tragic 19.2% |
| Apache | 0.0 /100 | #332 | Tragic 19.2% |
| Immigrants | Dominican Republic | 0.0 /100 | #333 | Tragic 19.3% |
| Houma | 0.0 /100 | #334 | Tragic 20.0% |
Demographics Similar to Syrians by Female Poverty
In terms of female poverty, the demographic groups most similar to Syrians are Afghan (13.0%, a difference of 0.030%), Immigrants from Peru (13.0%, a difference of 0.080%), Immigrants from Malaysia (13.0%, a difference of 0.12%), Brazilian (13.0%, a difference of 0.14%), and Immigrants from Kazakhstan (13.0%, a difference of 0.16%).
| Demographics | Rating | Rank | Female Poverty |
| Immigrants | France | 83.6 /100 | #138 | Excellent 12.9% |
| Basques | 83.1 /100 | #139 | Excellent 12.9% |
| Pakistanis | 83.0 /100 | #140 | Excellent 12.9% |
| Icelanders | 81.1 /100 | #141 | Excellent 13.0% |
| Brazilians | 80.5 /100 | #142 | Excellent 13.0% |
| Immigrants | Malaysia | 80.4 /100 | #143 | Excellent 13.0% |
| Afghans | 79.8 /100 | #144 | Good 13.0% |
| Syrians | 79.6 /100 | #145 | Good 13.0% |
| Immigrants | Peru | 79.1 /100 | #146 | Good 13.0% |
| Immigrants | Kazakhstan | 78.6 /100 | #147 | Good 13.0% |
| Yugoslavians | 76.9 /100 | #148 | Good 13.1% |
| Taiwanese | 75.7 /100 | #149 | Good 13.1% |
| Tsimshian | 75.5 /100 | #150 | Good 13.1% |
| Immigrants | Germany | 74.9 /100 | #151 | Good 13.1% |
| Samoans | 73.6 /100 | #152 | Good 13.1% |