Yakama vs Syrian Child Poverty Under the Age of 16
COMPARE
Yakama
Syrian
Child Poverty Under the Age of 16
Child Poverty Under the Age of 16 Comparison
Yakama
Syrians
22.1%
CHILD POVERTY UNDER THE AGE OF 16
0.0/ 100
METRIC RATING
319th/ 347
METRIC RANK
15.6%
CHILD POVERTY UNDER THE AGE OF 16
76.1/ 100
METRIC RATING
155th/ 347
METRIC RANK
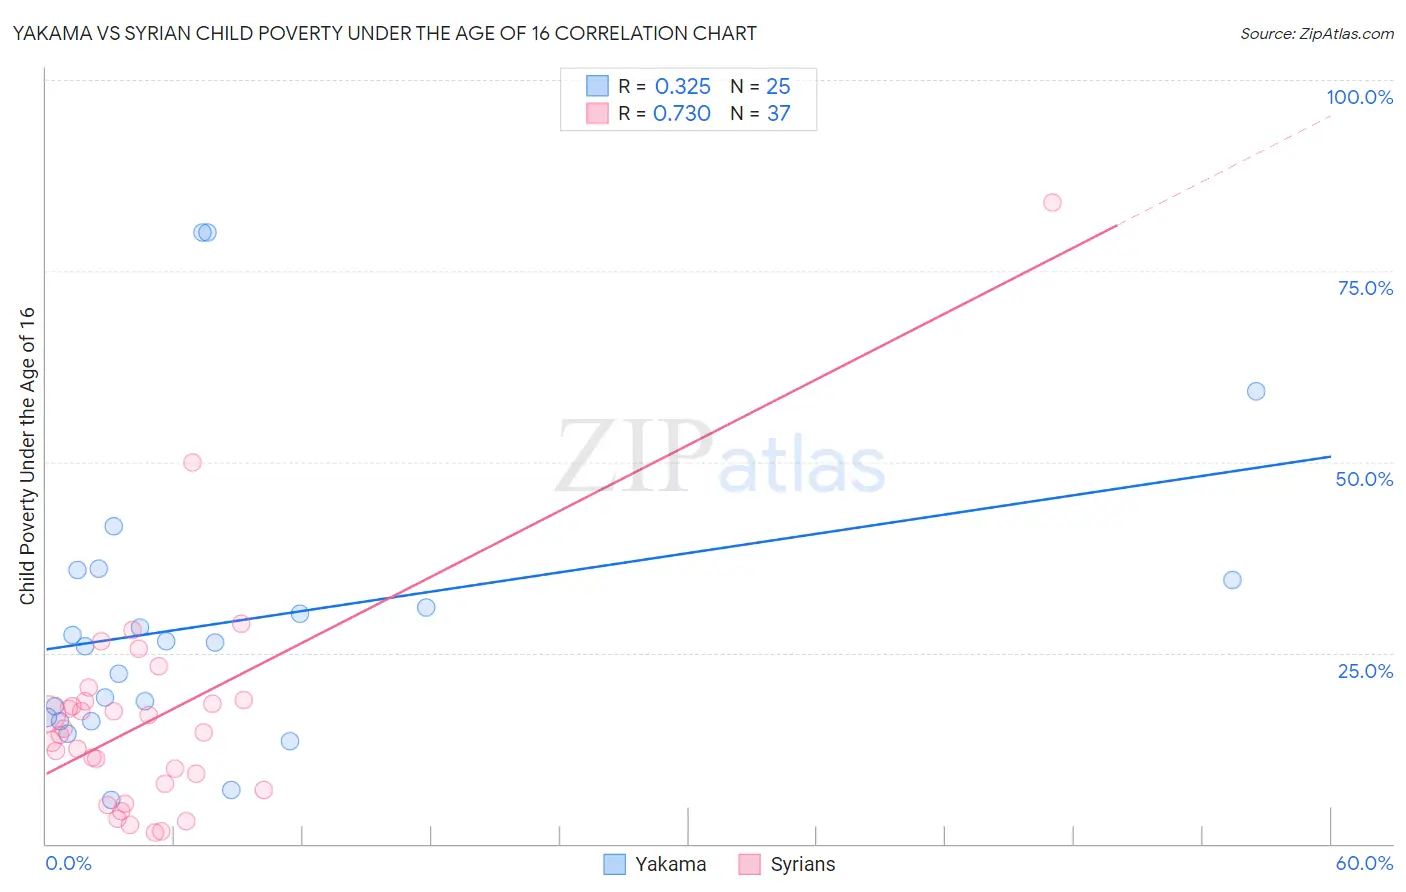
Yakama vs Syrian Child Poverty Under the Age of 16 Correlation Chart
The statistical analysis conducted on geographies consisting of 19,893,282 people shows a mild positive correlation between the proportion of Yakama and poverty level among children under the age of 16 in the United States with a correlation coefficient (R) of 0.325 and weighted average of 22.1%. Similarly, the statistical analysis conducted on geographies consisting of 264,232,814 people shows a strong positive correlation between the proportion of Syrians and poverty level among children under the age of 16 in the United States with a correlation coefficient (R) of 0.730 and weighted average of 15.6%, a difference of 41.1%.
Child Poverty Under the Age of 16 Correlation Summary
| Measurement | Yakama | Syrian |
| Minimum | 5.7% | 1.5% |
| Maximum | 80.0% | 84.0% |
| Range | 74.3% | 82.5% |
| Mean | 29.2% | 16.5% |
| Median | 26.3% | 14.5% |
| Interquartile 25% (IQ1) | 16.3% | 7.5% |
| Interquartile 75% (IQ3) | 35.2% | 18.7% |
| Interquartile Range (IQR) | 18.9% | 11.2% |
| Standard Deviation (Sample) | 19.1% | 14.9% |
| Standard Deviation (Population) | 18.7% | 14.7% |
Similar Demographics by Child Poverty Under the Age of 16
Demographics Similar to Yakama by Child Poverty Under the Age of 16
In terms of child poverty under the age of 16, the demographic groups most similar to Yakama are Cajun (22.1%, a difference of 0.20%), Kiowa (22.2%, a difference of 0.39%), U.S. Virgin Islander (22.0%, a difference of 0.51%), Honduran (22.2%, a difference of 0.58%), and Immigrants from Dominica (21.9%, a difference of 0.91%).
| Demographics | Rating | Rank | Child Poverty Under the Age of 16 |
| Ute | 0.0 /100 | #312 | Tragic 21.5% |
| Creek | 0.0 /100 | #313 | Tragic 21.5% |
| Immigrants | Somalia | 0.0 /100 | #314 | Tragic 21.6% |
| Immigrants | Guatemala | 0.0 /100 | #315 | Tragic 21.6% |
| Africans | 0.0 /100 | #316 | Tragic 21.7% |
| Immigrants | Dominica | 0.0 /100 | #317 | Tragic 21.9% |
| U.S. Virgin Islanders | 0.0 /100 | #318 | Tragic 22.0% |
| Yakama | 0.0 /100 | #319 | Tragic 22.1% |
| Cajuns | 0.0 /100 | #320 | Tragic 22.1% |
| Kiowa | 0.0 /100 | #321 | Tragic 22.2% |
| Hondurans | 0.0 /100 | #322 | Tragic 22.2% |
| Paiute | 0.0 /100 | #323 | Tragic 22.4% |
| Central American Indians | 0.0 /100 | #324 | Tragic 22.5% |
| Immigrants | Congo | 0.0 /100 | #325 | Tragic 22.5% |
| Immigrants | Honduras | 0.0 /100 | #326 | Tragic 22.7% |
Demographics Similar to Syrians by Child Poverty Under the Age of 16
In terms of child poverty under the age of 16, the demographic groups most similar to Syrians are Immigrants from Venezuela (15.7%, a difference of 0.20%), Samoan (15.6%, a difference of 0.21%), Venezuelan (15.6%, a difference of 0.24%), French Canadian (15.6%, a difference of 0.38%), and Immigrants from Jordan (15.6%, a difference of 0.42%).
| Demographics | Rating | Rank | Child Poverty Under the Age of 16 |
| Puget Sound Salish | 80.3 /100 | #148 | Excellent 15.5% |
| Israelis | 80.1 /100 | #149 | Excellent 15.5% |
| Immigrants | Jordan | 78.5 /100 | #150 | Good 15.6% |
| French | 78.5 /100 | #151 | Good 15.6% |
| French Canadians | 78.2 /100 | #152 | Good 15.6% |
| Venezuelans | 77.4 /100 | #153 | Good 15.6% |
| Samoans | 77.3 /100 | #154 | Good 15.6% |
| Syrians | 76.1 /100 | #155 | Good 15.6% |
| Immigrants | Venezuela | 74.9 /100 | #156 | Good 15.7% |
| Immigrants | Nepal | 72.9 /100 | #157 | Good 15.7% |
| Immigrants | Chile | 72.8 /100 | #158 | Good 15.7% |
| Immigrants | Fiji | 71.1 /100 | #159 | Good 15.8% |
| Immigrants | Albania | 70.7 /100 | #160 | Good 15.8% |
| Immigrants | Northern Africa | 68.1 /100 | #161 | Good 15.8% |
| Colombians | 67.6 /100 | #162 | Good 15.8% |