Yakama vs Immigrants from Moldova Receiving Food Stamps
COMPARE
Yakama
Immigrants from Moldova
Receiving Food Stamps
Receiving Food Stamps Comparison
Yakama
Immigrants from Moldova
21.4%
RECEIVING FOOD STAMPS
0.0/ 100
METRIC RATING
339th/ 347
METRIC RANK
10.9%
RECEIVING FOOD STAMPS
88.5/ 100
METRIC RATING
138th/ 347
METRIC RANK
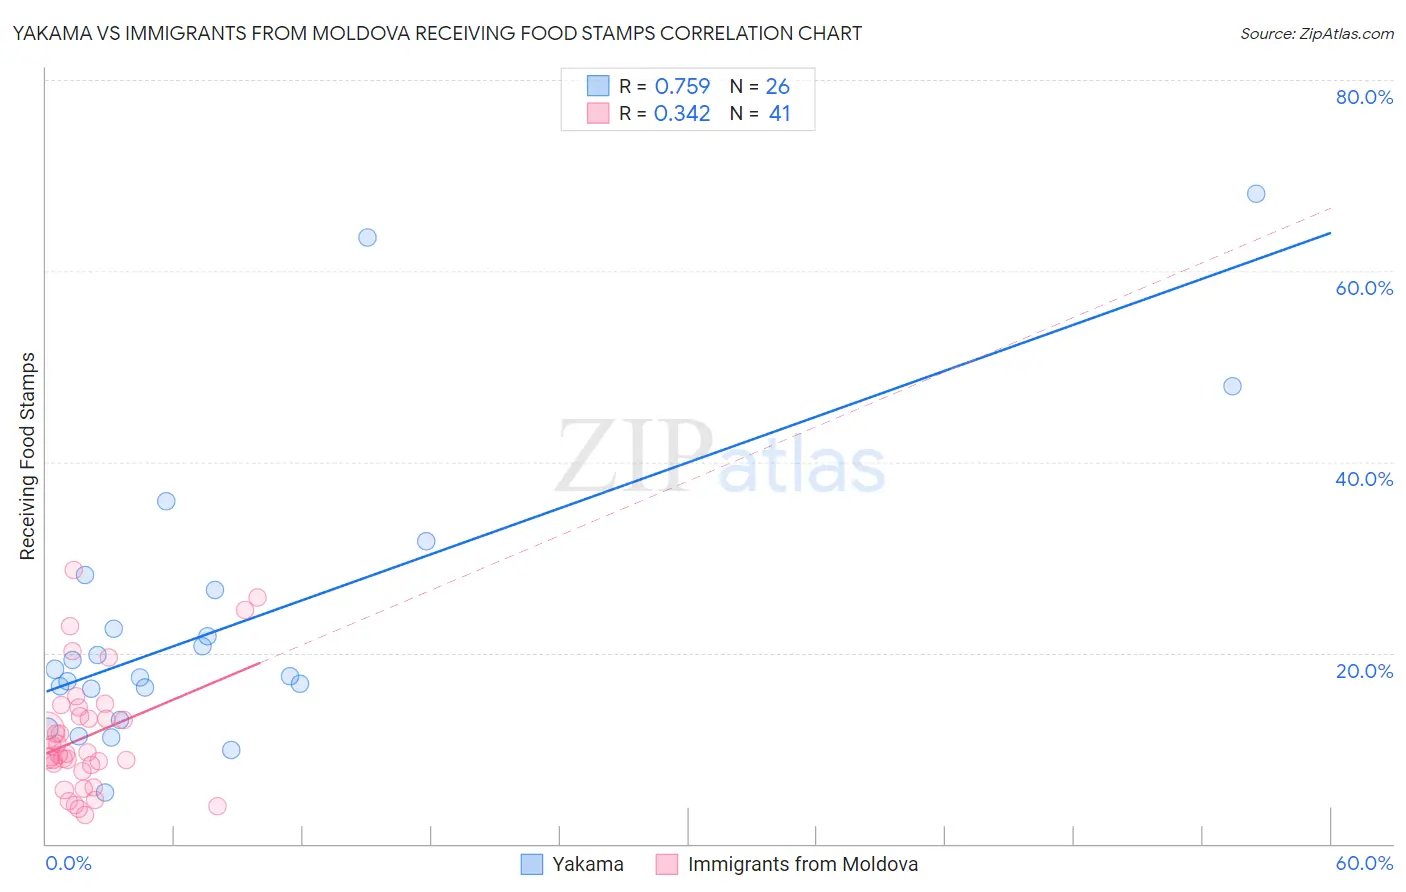
Yakama vs Immigrants from Moldova Receiving Food Stamps Correlation Chart
The statistical analysis conducted on geographies consisting of 19,916,824 people shows a strong positive correlation between the proportion of Yakama and percentage of population receiving government assistance and/or food stamps in the United States with a correlation coefficient (R) of 0.759 and weighted average of 21.4%. Similarly, the statistical analysis conducted on geographies consisting of 124,289,346 people shows a mild positive correlation between the proportion of Immigrants from Moldova and percentage of population receiving government assistance and/or food stamps in the United States with a correlation coefficient (R) of 0.342 and weighted average of 10.9%, a difference of 96.5%.
Receiving Food Stamps Correlation Summary
| Measurement | Yakama | Immigrants from Moldova |
| Minimum | 5.4% | 3.0% |
| Maximum | 68.1% | 28.7% |
| Range | 62.7% | 25.7% |
| Mean | 23.3% | 11.3% |
| Median | 17.9% | 9.4% |
| Interquartile 25% (IQ1) | 16.3% | 7.9% |
| Interquartile 75% (IQ3) | 26.6% | 13.8% |
| Interquartile Range (IQR) | 10.3% | 5.9% |
| Standard Deviation (Sample) | 15.3% | 6.2% |
| Standard Deviation (Population) | 15.0% | 6.1% |
Similar Demographics by Receiving Food Stamps
Demographics Similar to Yakama by Receiving Food Stamps
In terms of receiving food stamps, the demographic groups most similar to Yakama are Dominican (21.4%, a difference of 0.26%), Tohono O'odham (21.5%, a difference of 0.26%), Hopi (21.6%, a difference of 0.63%), Immigrants from Yemen (21.6%, a difference of 1.0%), and Cape Verdean (21.1%, a difference of 1.7%).
| Demographics | Rating | Rank | Receiving Food Stamps |
| Pueblo | 0.0 /100 | #332 | Tragic 19.9% |
| Inupiat | 0.0 /100 | #333 | Tragic 20.1% |
| Yuman | 0.0 /100 | #334 | Tragic 20.2% |
| Immigrants | Cuba | 0.0 /100 | #335 | Tragic 20.8% |
| Navajo | 0.0 /100 | #336 | Tragic 21.1% |
| Cape Verdeans | 0.0 /100 | #337 | Tragic 21.1% |
| Dominicans | 0.0 /100 | #338 | Tragic 21.4% |
| Yakama | 0.0 /100 | #339 | Tragic 21.4% |
| Tohono O'odham | 0.0 /100 | #340 | Tragic 21.5% |
| Hopi | 0.0 /100 | #341 | Tragic 21.6% |
| Immigrants | Yemen | 0.0 /100 | #342 | Tragic 21.6% |
| Immigrants | Dominican Republic | 0.0 /100 | #343 | Tragic 22.1% |
| Lumbee | 0.0 /100 | #344 | Tragic 22.9% |
| Immigrants | Cabo Verde | 0.0 /100 | #345 | Tragic 23.8% |
| Puerto Ricans | 0.0 /100 | #346 | Tragic 26.0% |
Demographics Similar to Immigrants from Moldova by Receiving Food Stamps
In terms of receiving food stamps, the demographic groups most similar to Immigrants from Moldova are Hmong (10.9%, a difference of 0.040%), Celtic (10.9%, a difference of 0.24%), Immigrants from Eastern Europe (10.8%, a difference of 0.51%), Slovak (10.8%, a difference of 0.53%), and Immigrants from Vietnam (11.0%, a difference of 0.61%).
| Demographics | Rating | Rank | Receiving Food Stamps |
| French | 92.3 /100 | #131 | Exceptional 10.7% |
| Immigrants | Germany | 92.0 /100 | #132 | Exceptional 10.7% |
| Immigrants | Russia | 90.9 /100 | #133 | Exceptional 10.8% |
| Immigrants | Brazil | 90.3 /100 | #134 | Exceptional 10.8% |
| Argentineans | 90.2 /100 | #135 | Exceptional 10.8% |
| Slovaks | 89.8 /100 | #136 | Excellent 10.8% |
| Immigrants | Eastern Europe | 89.8 /100 | #137 | Excellent 10.8% |
| Immigrants | Moldova | 88.5 /100 | #138 | Excellent 10.9% |
| Hmong | 88.4 /100 | #139 | Excellent 10.9% |
| Celtics | 87.8 /100 | #140 | Excellent 10.9% |
| Immigrants | Vietnam | 86.7 /100 | #141 | Excellent 11.0% |
| Chileans | 86.2 /100 | #142 | Excellent 11.0% |
| Immigrants | Northern Africa | 86.0 /100 | #143 | Excellent 11.0% |
| Syrians | 85.5 /100 | #144 | Excellent 11.0% |
| Hungarians | 85.1 /100 | #145 | Excellent 11.0% |