Northern European vs Colombian Receiving Food Stamps
COMPARE
Northern European
Colombian
Receiving Food Stamps
Receiving Food Stamps Comparison
Northern Europeans
Colombians
9.8%
RECEIVING FOOD STAMPS
99.0/ 100
METRIC RATING
68th/ 347
METRIC RANK
12.6%
RECEIVING FOOD STAMPS
10.2/ 100
METRIC RATING
211th/ 347
METRIC RANK
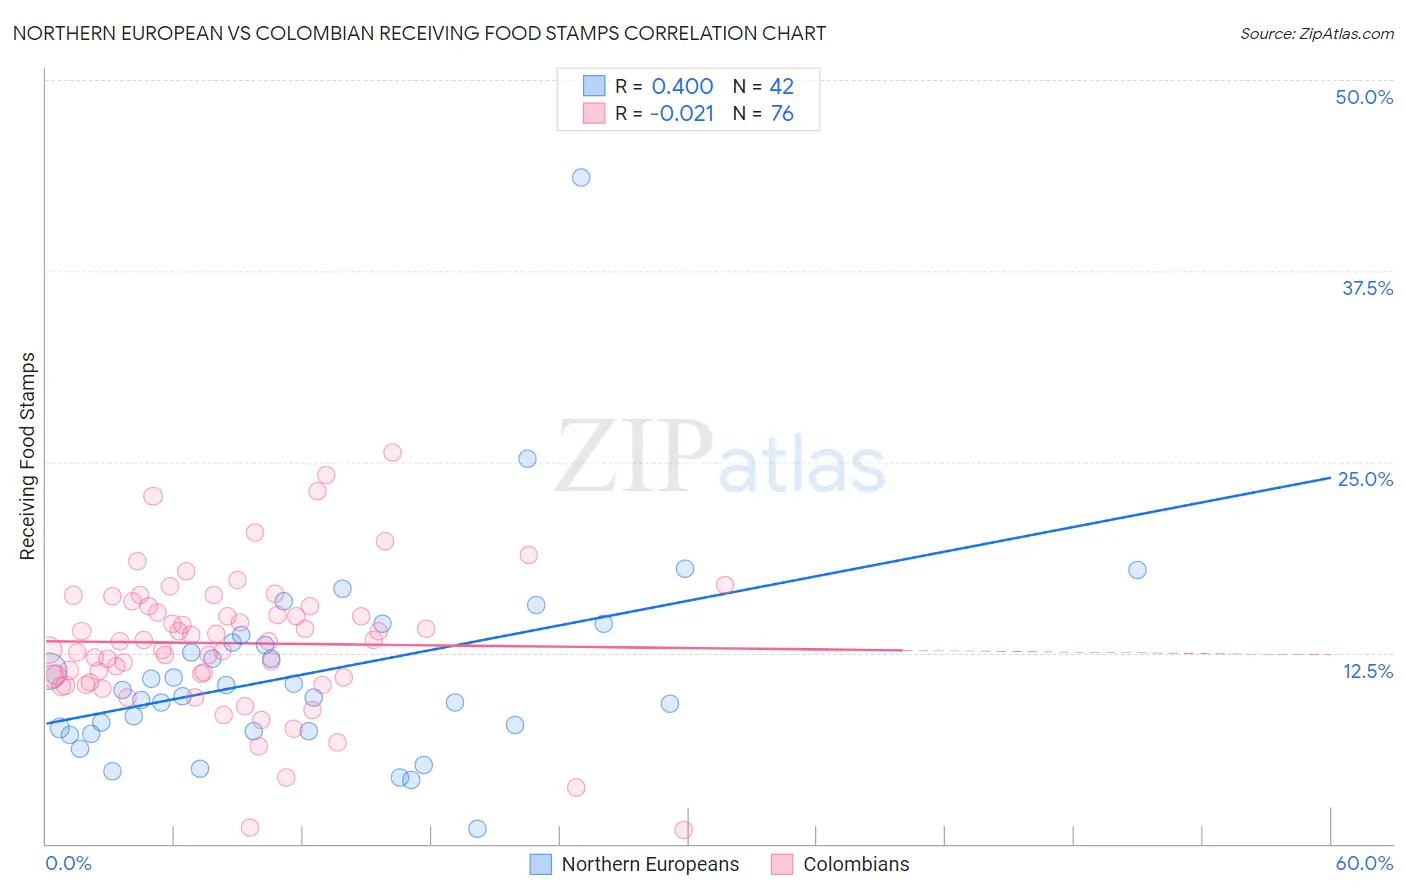
Northern European vs Colombian Receiving Food Stamps Correlation Chart
The statistical analysis conducted on geographies consisting of 404,897,441 people shows a moderate positive correlation between the proportion of Northern Europeans and percentage of population receiving government assistance and/or food stamps in the United States with a correlation coefficient (R) of 0.400 and weighted average of 9.8%. Similarly, the statistical analysis conducted on geographies consisting of 418,206,966 people shows no correlation between the proportion of Colombians and percentage of population receiving government assistance and/or food stamps in the United States with a correlation coefficient (R) of -0.021 and weighted average of 12.6%, a difference of 28.4%.
Receiving Food Stamps Correlation Summary
| Measurement | Northern European | Colombian |
| Minimum | 1.0% | 0.90% |
| Maximum | 43.6% | 25.6% |
| Range | 42.6% | 24.7% |
| Mean | 11.2% | 13.1% |
| Median | 9.9% | 13.3% |
| Interquartile 25% (IQ1) | 7.4% | 10.7% |
| Interquartile 75% (IQ3) | 13.2% | 15.5% |
| Interquartile Range (IQR) | 5.8% | 4.8% |
| Standard Deviation (Sample) | 6.8% | 4.6% |
| Standard Deviation (Population) | 6.8% | 4.5% |
Similar Demographics by Receiving Food Stamps
Demographics Similar to Northern Europeans by Receiving Food Stamps
In terms of receiving food stamps, the demographic groups most similar to Northern Europeans are Immigrants from Indonesia (9.8%, a difference of 0.060%), Italian (9.9%, a difference of 0.21%), Slovene (9.8%, a difference of 0.22%), Immigrants from Serbia (9.9%, a difference of 0.26%), and Scottish (9.9%, a difference of 0.39%).
| Demographics | Rating | Rank | Receiving Food Stamps |
| English | 99.2 /100 | #61 | Exceptional 9.8% |
| Immigrants | Bulgaria | 99.2 /100 | #62 | Exceptional 9.8% |
| Chinese | 99.2 /100 | #63 | Exceptional 9.8% |
| Immigrants | North America | 99.2 /100 | #64 | Exceptional 9.8% |
| Immigrants | Turkey | 99.1 /100 | #65 | Exceptional 9.8% |
| Slovenes | 99.1 /100 | #66 | Exceptional 9.8% |
| Immigrants | Indonesia | 99.0 /100 | #67 | Exceptional 9.8% |
| Northern Europeans | 99.0 /100 | #68 | Exceptional 9.8% |
| Italians | 99.0 /100 | #69 | Exceptional 9.9% |
| Immigrants | Serbia | 99.0 /100 | #70 | Exceptional 9.9% |
| Scottish | 98.9 /100 | #71 | Exceptional 9.9% |
| Immigrants | Asia | 98.9 /100 | #72 | Exceptional 9.9% |
| Macedonians | 98.9 /100 | #73 | Exceptional 9.9% |
| New Zealanders | 98.8 /100 | #74 | Exceptional 9.9% |
| Immigrants | Zimbabwe | 98.7 /100 | #75 | Exceptional 9.9% |
Demographics Similar to Colombians by Receiving Food Stamps
In terms of receiving food stamps, the demographic groups most similar to Colombians are Malaysian (12.7%, a difference of 0.63%), Immigrants from Uruguay (12.5%, a difference of 0.83%), Immigrants from Sierra Leone (12.5%, a difference of 0.86%), Moroccan (12.8%, a difference of 1.0%), and Immigrants from Africa (12.8%, a difference of 1.1%).
| Demographics | Rating | Rank | Receiving Food Stamps |
| Immigrants | Nonimmigrants | 17.6 /100 | #204 | Poor 12.4% |
| Aleuts | 17.3 /100 | #205 | Poor 12.4% |
| Immigrants | Thailand | 17.0 /100 | #206 | Poor 12.4% |
| South Americans | 16.0 /100 | #207 | Poor 12.4% |
| Potawatomi | 14.6 /100 | #208 | Poor 12.5% |
| Immigrants | Sierra Leone | 12.9 /100 | #209 | Poor 12.5% |
| Immigrants | Uruguay | 12.8 /100 | #210 | Poor 12.5% |
| Colombians | 10.2 /100 | #211 | Poor 12.6% |
| Malaysians | 8.5 /100 | #212 | Tragic 12.7% |
| Moroccans | 7.6 /100 | #213 | Tragic 12.8% |
| Immigrants | Africa | 7.6 /100 | #214 | Tragic 12.8% |
| Native Hawaiians | 6.7 /100 | #215 | Tragic 12.8% |
| Immigrants | South America | 6.5 /100 | #216 | Tragic 12.8% |
| Immigrants | Burma/Myanmar | 6.0 /100 | #217 | Tragic 12.9% |
| Hawaiians | 5.4 /100 | #218 | Tragic 12.9% |