Vietnamese vs Colombian Receiving Food Stamps
COMPARE
Vietnamese
Colombian
Receiving Food Stamps
Receiving Food Stamps Comparison
Vietnamese
Colombians
15.7%
RECEIVING FOOD STAMPS
0.0/ 100
METRIC RATING
293rd/ 347
METRIC RANK
12.6%
RECEIVING FOOD STAMPS
10.2/ 100
METRIC RATING
211th/ 347
METRIC RANK
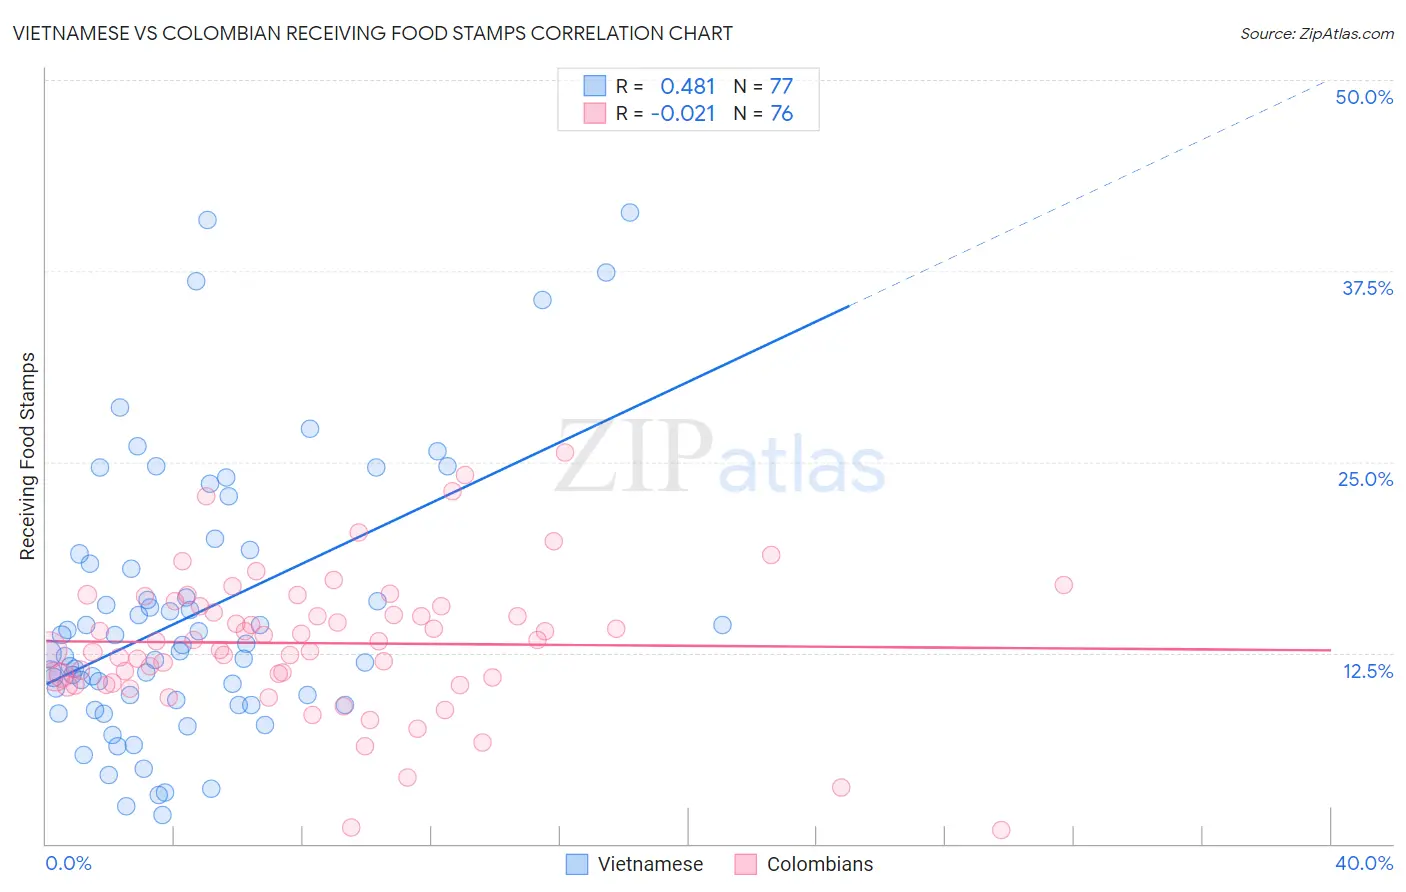
Vietnamese vs Colombian Receiving Food Stamps Correlation Chart
The statistical analysis conducted on geographies consisting of 170,448,665 people shows a moderate positive correlation between the proportion of Vietnamese and percentage of population receiving government assistance and/or food stamps in the United States with a correlation coefficient (R) of 0.481 and weighted average of 15.7%. Similarly, the statistical analysis conducted on geographies consisting of 418,206,966 people shows no correlation between the proportion of Colombians and percentage of population receiving government assistance and/or food stamps in the United States with a correlation coefficient (R) of -0.021 and weighted average of 12.6%, a difference of 24.0%.
Receiving Food Stamps Correlation Summary
| Measurement | Vietnamese | Colombian |
| Minimum | 1.9% | 0.90% |
| Maximum | 41.3% | 25.6% |
| Range | 39.4% | 24.7% |
| Mean | 15.0% | 13.1% |
| Median | 12.6% | 13.3% |
| Interquartile 25% (IQ1) | 9.2% | 10.7% |
| Interquartile 75% (IQ3) | 18.6% | 15.5% |
| Interquartile Range (IQR) | 9.4% | 4.8% |
| Standard Deviation (Sample) | 8.8% | 4.6% |
| Standard Deviation (Population) | 8.8% | 4.5% |
Similar Demographics by Receiving Food Stamps
Demographics Similar to Vietnamese by Receiving Food Stamps
In terms of receiving food stamps, the demographic groups most similar to Vietnamese are Immigrants from Latin America (15.7%, a difference of 0.11%), Alaska Native (15.6%, a difference of 0.30%), Immigrants from Honduras (15.7%, a difference of 0.43%), Tsimshian (15.7%, a difference of 0.44%), and Immigrants from Bahamas (15.8%, a difference of 0.60%).
| Demographics | Rating | Rank | Receiving Food Stamps |
| Africans | 0.0 /100 | #286 | Tragic 15.1% |
| Immigrants | Mexico | 0.0 /100 | #287 | Tragic 15.2% |
| Immigrants | Belize | 0.0 /100 | #288 | Tragic 15.2% |
| Immigrants | Senegal | 0.0 /100 | #289 | Tragic 15.3% |
| Senegalese | 0.0 /100 | #290 | Tragic 15.4% |
| Hondurans | 0.0 /100 | #291 | Tragic 15.5% |
| Alaska Natives | 0.0 /100 | #292 | Tragic 15.6% |
| Vietnamese | 0.0 /100 | #293 | Tragic 15.7% |
| Immigrants | Latin America | 0.0 /100 | #294 | Tragic 15.7% |
| Immigrants | Honduras | 0.0 /100 | #295 | Tragic 15.7% |
| Tsimshian | 0.0 /100 | #296 | Tragic 15.7% |
| Immigrants | Bahamas | 0.0 /100 | #297 | Tragic 15.8% |
| Immigrants | Trinidad and Tobago | 0.0 /100 | #298 | Tragic 15.8% |
| Hispanics or Latinos | 0.0 /100 | #299 | Tragic 15.8% |
| Immigrants | Bangladesh | 0.0 /100 | #300 | Tragic 15.9% |
Demographics Similar to Colombians by Receiving Food Stamps
In terms of receiving food stamps, the demographic groups most similar to Colombians are Malaysian (12.7%, a difference of 0.63%), Immigrants from Uruguay (12.5%, a difference of 0.83%), Immigrants from Sierra Leone (12.5%, a difference of 0.86%), Moroccan (12.8%, a difference of 1.0%), and Immigrants from Africa (12.8%, a difference of 1.1%).
| Demographics | Rating | Rank | Receiving Food Stamps |
| Immigrants | Nonimmigrants | 17.6 /100 | #204 | Poor 12.4% |
| Aleuts | 17.3 /100 | #205 | Poor 12.4% |
| Immigrants | Thailand | 17.0 /100 | #206 | Poor 12.4% |
| South Americans | 16.0 /100 | #207 | Poor 12.4% |
| Potawatomi | 14.6 /100 | #208 | Poor 12.5% |
| Immigrants | Sierra Leone | 12.9 /100 | #209 | Poor 12.5% |
| Immigrants | Uruguay | 12.8 /100 | #210 | Poor 12.5% |
| Colombians | 10.2 /100 | #211 | Poor 12.6% |
| Malaysians | 8.5 /100 | #212 | Tragic 12.7% |
| Moroccans | 7.6 /100 | #213 | Tragic 12.8% |
| Immigrants | Africa | 7.6 /100 | #214 | Tragic 12.8% |
| Native Hawaiians | 6.7 /100 | #215 | Tragic 12.8% |
| Immigrants | South America | 6.5 /100 | #216 | Tragic 12.8% |
| Immigrants | Burma/Myanmar | 6.0 /100 | #217 | Tragic 12.9% |
| Hawaiians | 5.4 /100 | #218 | Tragic 12.9% |