Yakama vs Immigrants from West Indies Receiving Food Stamps
COMPARE
Yakama
Immigrants from West Indies
Receiving Food Stamps
Receiving Food Stamps Comparison
Yakama
Immigrants from West Indies
21.4%
RECEIVING FOOD STAMPS
0.0/ 100
METRIC RATING
339th/ 347
METRIC RANK
16.1%
RECEIVING FOOD STAMPS
0.0/ 100
METRIC RATING
302nd/ 347
METRIC RANK
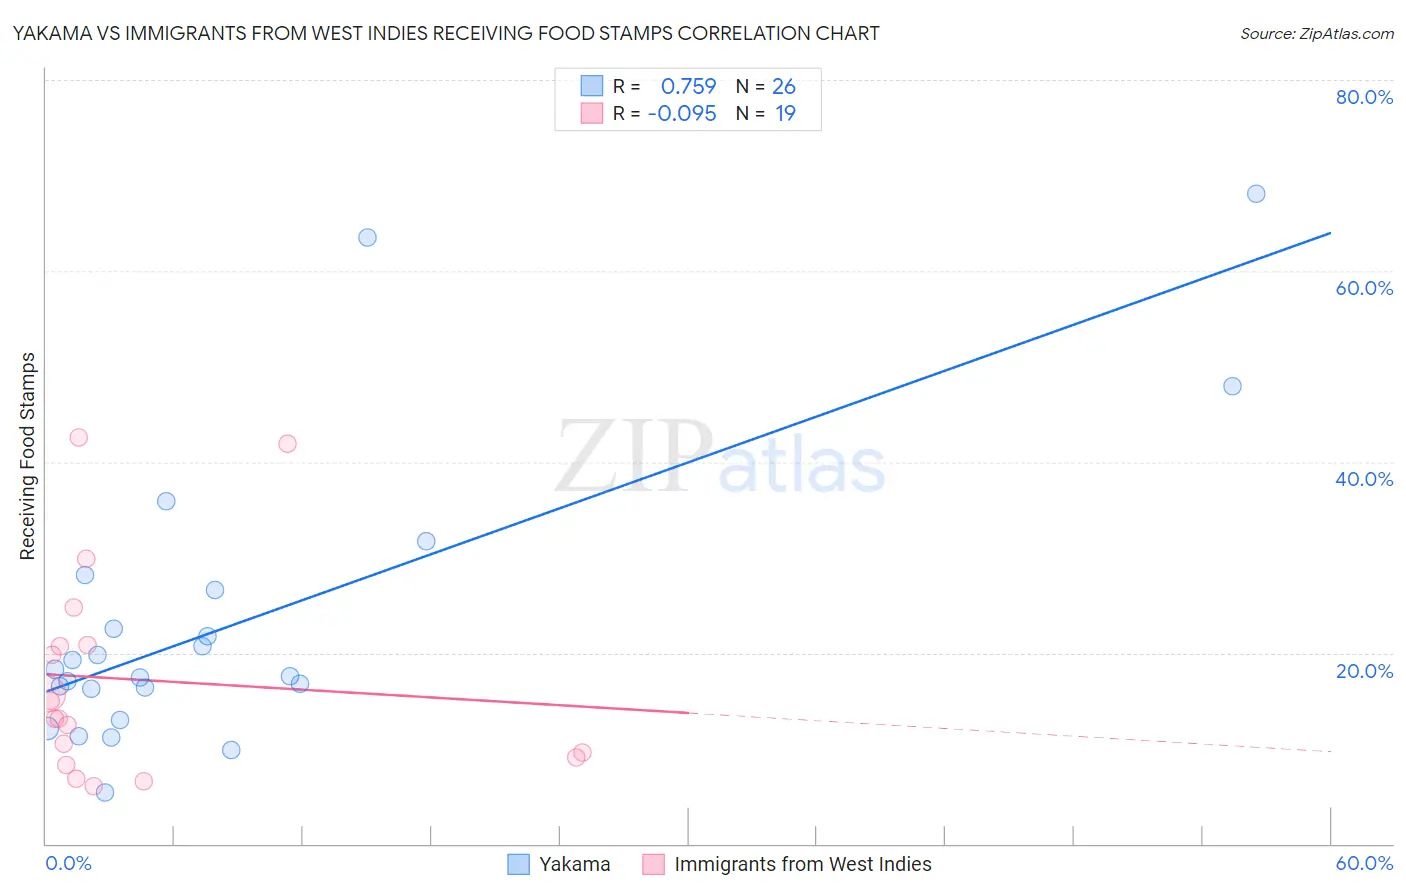
Yakama vs Immigrants from West Indies Receiving Food Stamps Correlation Chart
The statistical analysis conducted on geographies consisting of 19,916,824 people shows a strong positive correlation between the proportion of Yakama and percentage of population receiving government assistance and/or food stamps in the United States with a correlation coefficient (R) of 0.759 and weighted average of 21.4%. Similarly, the statistical analysis conducted on geographies consisting of 72,442,413 people shows a slight negative correlation between the proportion of Immigrants from West Indies and percentage of population receiving government assistance and/or food stamps in the United States with a correlation coefficient (R) of -0.095 and weighted average of 16.1%, a difference of 32.8%.
Receiving Food Stamps Correlation Summary
| Measurement | Yakama | Immigrants from West Indies |
| Minimum | 5.4% | 6.0% |
| Maximum | 68.1% | 42.5% |
| Range | 62.7% | 36.5% |
| Mean | 23.3% | 17.2% |
| Median | 17.9% | 13.1% |
| Interquartile 25% (IQ1) | 16.3% | 9.0% |
| Interquartile 75% (IQ3) | 26.6% | 20.9% |
| Interquartile Range (IQR) | 10.3% | 11.9% |
| Standard Deviation (Sample) | 15.3% | 10.9% |
| Standard Deviation (Population) | 15.0% | 10.7% |
Similar Demographics by Receiving Food Stamps
Demographics Similar to Yakama by Receiving Food Stamps
In terms of receiving food stamps, the demographic groups most similar to Yakama are Dominican (21.4%, a difference of 0.26%), Tohono O'odham (21.5%, a difference of 0.26%), Hopi (21.6%, a difference of 0.63%), Immigrants from Yemen (21.6%, a difference of 1.0%), and Cape Verdean (21.1%, a difference of 1.7%).
| Demographics | Rating | Rank | Receiving Food Stamps |
| Pueblo | 0.0 /100 | #332 | Tragic 19.9% |
| Inupiat | 0.0 /100 | #333 | Tragic 20.1% |
| Yuman | 0.0 /100 | #334 | Tragic 20.2% |
| Immigrants | Cuba | 0.0 /100 | #335 | Tragic 20.8% |
| Navajo | 0.0 /100 | #336 | Tragic 21.1% |
| Cape Verdeans | 0.0 /100 | #337 | Tragic 21.1% |
| Dominicans | 0.0 /100 | #338 | Tragic 21.4% |
| Yakama | 0.0 /100 | #339 | Tragic 21.4% |
| Tohono O'odham | 0.0 /100 | #340 | Tragic 21.5% |
| Hopi | 0.0 /100 | #341 | Tragic 21.6% |
| Immigrants | Yemen | 0.0 /100 | #342 | Tragic 21.6% |
| Immigrants | Dominican Republic | 0.0 /100 | #343 | Tragic 22.1% |
| Lumbee | 0.0 /100 | #344 | Tragic 22.9% |
| Immigrants | Cabo Verde | 0.0 /100 | #345 | Tragic 23.8% |
| Puerto Ricans | 0.0 /100 | #346 | Tragic 26.0% |
Demographics Similar to Immigrants from West Indies by Receiving Food Stamps
In terms of receiving food stamps, the demographic groups most similar to Immigrants from West Indies are Nicaraguan (16.1%, a difference of 0.090%), West Indian (16.3%, a difference of 0.77%), Trinidadian and Tobagonian (16.0%, a difference of 0.94%), Immigrants from Bangladesh (15.9%, a difference of 1.4%), and Immigrants from the Azores (16.4%, a difference of 1.7%).
| Demographics | Rating | Rank | Receiving Food Stamps |
| Immigrants | Honduras | 0.0 /100 | #295 | Tragic 15.7% |
| Tsimshian | 0.0 /100 | #296 | Tragic 15.7% |
| Immigrants | Bahamas | 0.0 /100 | #297 | Tragic 15.8% |
| Immigrants | Trinidad and Tobago | 0.0 /100 | #298 | Tragic 15.8% |
| Hispanics or Latinos | 0.0 /100 | #299 | Tragic 15.8% |
| Immigrants | Bangladesh | 0.0 /100 | #300 | Tragic 15.9% |
| Trinidadians and Tobagonians | 0.0 /100 | #301 | Tragic 16.0% |
| Immigrants | West Indies | 0.0 /100 | #302 | Tragic 16.1% |
| Nicaraguans | 0.0 /100 | #303 | Tragic 16.1% |
| West Indians | 0.0 /100 | #304 | Tragic 16.3% |
| Immigrants | Azores | 0.0 /100 | #305 | Tragic 16.4% |
| Jamaicans | 0.0 /100 | #306 | Tragic 16.4% |
| Houma | 0.0 /100 | #307 | Tragic 16.5% |
| Barbadians | 0.0 /100 | #308 | Tragic 16.5% |
| U.S. Virgin Islanders | 0.0 /100 | #309 | Tragic 16.5% |