White/Caucasian vs Immigrants from Armenia Single Male Poverty
COMPARE
White/Caucasian
Immigrants from Armenia
Single Male Poverty
Single Male Poverty Comparison
Whites/Caucasians
Immigrants from Armenia
14.5%
SINGLE MALE POVERTY
0.0/ 100
METRIC RATING
288th/ 347
METRIC RANK
12.2%
SINGLE MALE POVERTY
96.7/ 100
METRIC RATING
103rd/ 347
METRIC RANK
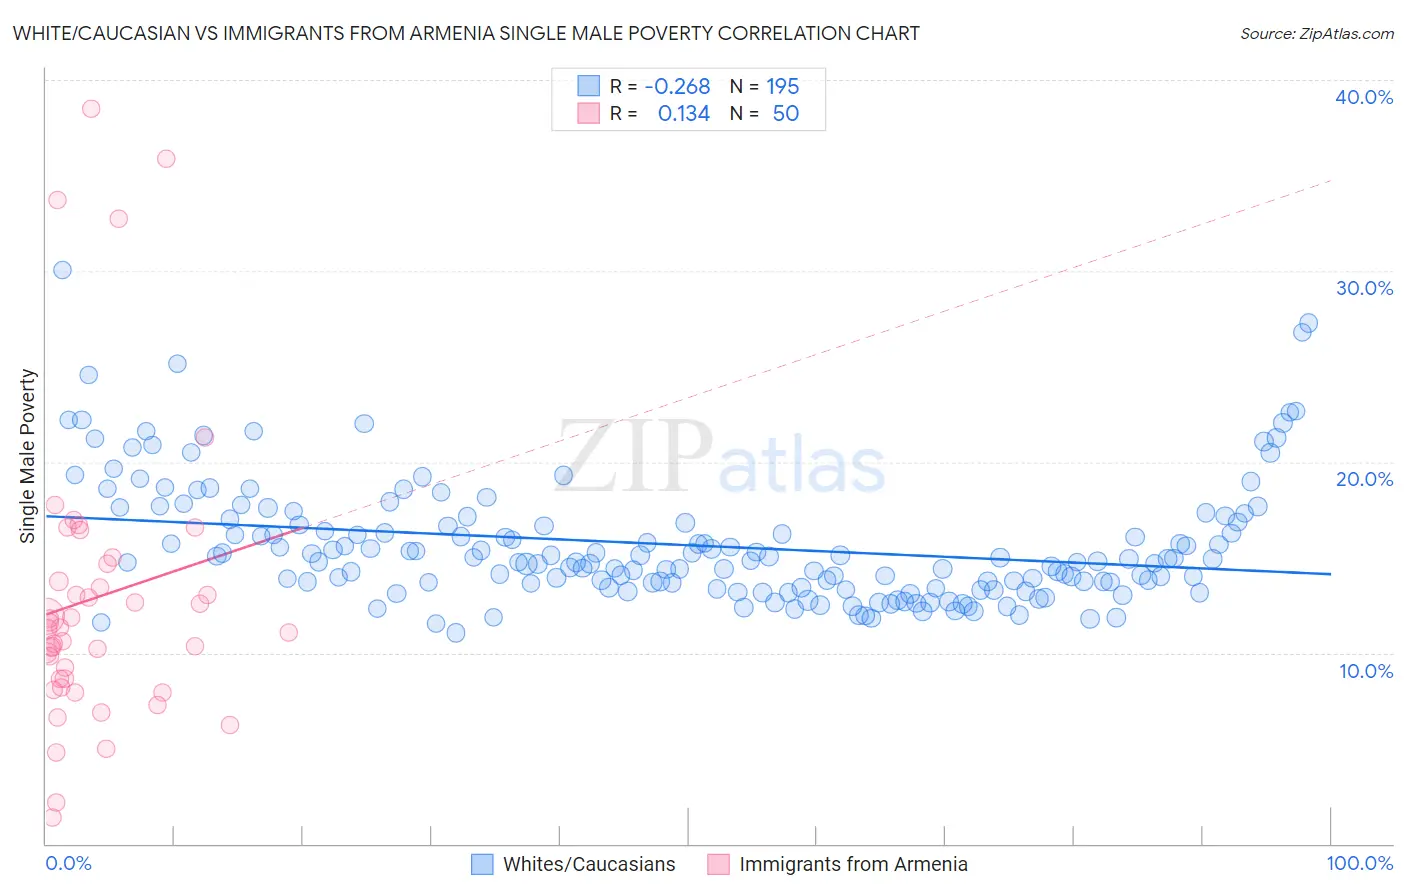
White/Caucasian vs Immigrants from Armenia Single Male Poverty Correlation Chart
The statistical analysis conducted on geographies consisting of 478,066,159 people shows a weak negative correlation between the proportion of Whites/Caucasians and poverty level among single males in the United States with a correlation coefficient (R) of -0.268 and weighted average of 14.5%. Similarly, the statistical analysis conducted on geographies consisting of 92,879,855 people shows a poor positive correlation between the proportion of Immigrants from Armenia and poverty level among single males in the United States with a correlation coefficient (R) of 0.134 and weighted average of 12.2%, a difference of 18.5%.
Single Male Poverty Correlation Summary
| Measurement | White/Caucasian | Immigrants from Armenia |
| Minimum | 11.1% | 1.4% |
| Maximum | 30.0% | 38.5% |
| Range | 19.0% | 37.2% |
| Mean | 15.6% | 12.9% |
| Median | 14.8% | 11.3% |
| Interquartile 25% (IQ1) | 13.6% | 8.7% |
| Interquartile 75% (IQ3) | 16.8% | 14.7% |
| Interquartile Range (IQR) | 3.2% | 6.0% |
| Standard Deviation (Sample) | 3.2% | 7.7% |
| Standard Deviation (Population) | 3.2% | 7.7% |
Similar Demographics by Single Male Poverty
Demographics Similar to Whites/Caucasians by Single Male Poverty
In terms of single male poverty, the demographic groups most similar to Whites/Caucasians are Iroquois (14.5%, a difference of 0.0%), Immigrants from Dominica (14.5%, a difference of 0.090%), Celtic (14.5%, a difference of 0.13%), U.S. Virgin Islander (14.5%, a difference of 0.31%), and French (14.4%, a difference of 0.45%).
| Demographics | Rating | Rank | Single Male Poverty |
| Hispanics or Latinos | 0.0 /100 | #281 | Tragic 14.2% |
| Spanish Americans | 0.0 /100 | #282 | Tragic 14.2% |
| Yaqui | 0.0 /100 | #283 | Tragic 14.2% |
| Immigrants | Bahamas | 0.0 /100 | #284 | Tragic 14.4% |
| French | 0.0 /100 | #285 | Tragic 14.4% |
| Celtics | 0.0 /100 | #286 | Tragic 14.5% |
| Iroquois | 0.0 /100 | #287 | Tragic 14.5% |
| Whites/Caucasians | 0.0 /100 | #288 | Tragic 14.5% |
| Immigrants | Dominica | 0.0 /100 | #289 | Tragic 14.5% |
| U.S. Virgin Islanders | 0.0 /100 | #290 | Tragic 14.5% |
| Bahamians | 0.0 /100 | #291 | Tragic 14.6% |
| Immigrants | Nonimmigrants | 0.0 /100 | #292 | Tragic 14.6% |
| French Canadians | 0.0 /100 | #293 | Tragic 14.6% |
| Ottawa | 0.0 /100 | #294 | Tragic 14.6% |
| Scotch-Irish | 0.0 /100 | #295 | Tragic 14.7% |
Demographics Similar to Immigrants from Armenia by Single Male Poverty
In terms of single male poverty, the demographic groups most similar to Immigrants from Armenia are Immigrants from Kazakhstan (12.2%, a difference of 0.010%), Immigrants from Europe (12.2%, a difference of 0.14%), Immigrants from Latvia (12.2%, a difference of 0.15%), Immigrants from Australia (12.2%, a difference of 0.18%), and Immigrants from Cuba (12.2%, a difference of 0.29%).
| Demographics | Rating | Rank | Single Male Poverty |
| Immigrants | Sweden | 97.5 /100 | #96 | Exceptional 12.2% |
| Immigrants | Italy | 97.4 /100 | #97 | Exceptional 12.2% |
| Guamanians/Chamorros | 97.4 /100 | #98 | Exceptional 12.2% |
| Immigrants | Cuba | 97.3 /100 | #99 | Exceptional 12.2% |
| Immigrants | Australia | 97.1 /100 | #100 | Exceptional 12.2% |
| Immigrants | Latvia | 97.0 /100 | #101 | Exceptional 12.2% |
| Immigrants | Europe | 97.0 /100 | #102 | Exceptional 12.2% |
| Immigrants | Armenia | 96.7 /100 | #103 | Exceptional 12.2% |
| Immigrants | Kazakhstan | 96.7 /100 | #104 | Exceptional 12.2% |
| Jordanians | 95.9 /100 | #105 | Exceptional 12.3% |
| Immigrants | Morocco | 95.6 /100 | #106 | Exceptional 12.3% |
| Iraqis | 95.1 /100 | #107 | Exceptional 12.3% |
| Immigrants | Eastern Africa | 95.0 /100 | #108 | Exceptional 12.3% |
| Ugandans | 94.5 /100 | #109 | Exceptional 12.3% |
| Immigrants | Portugal | 93.6 /100 | #110 | Exceptional 12.3% |