Welsh vs Immigrants from Spain Family Households with Children
COMPARE
Welsh
Immigrants from Spain
Family Households with Children
Family Households with Children Comparison
Welsh
Immigrants from Spain
27.2%
FAMILY HOUSEHOLDS WITH CHILDREN
14.2/ 100
METRIC RATING
211th/ 347
METRIC RANK
26.6%
FAMILY HOUSEHOLDS WITH CHILDREN
0.5/ 100
METRIC RATING
276th/ 347
METRIC RANK
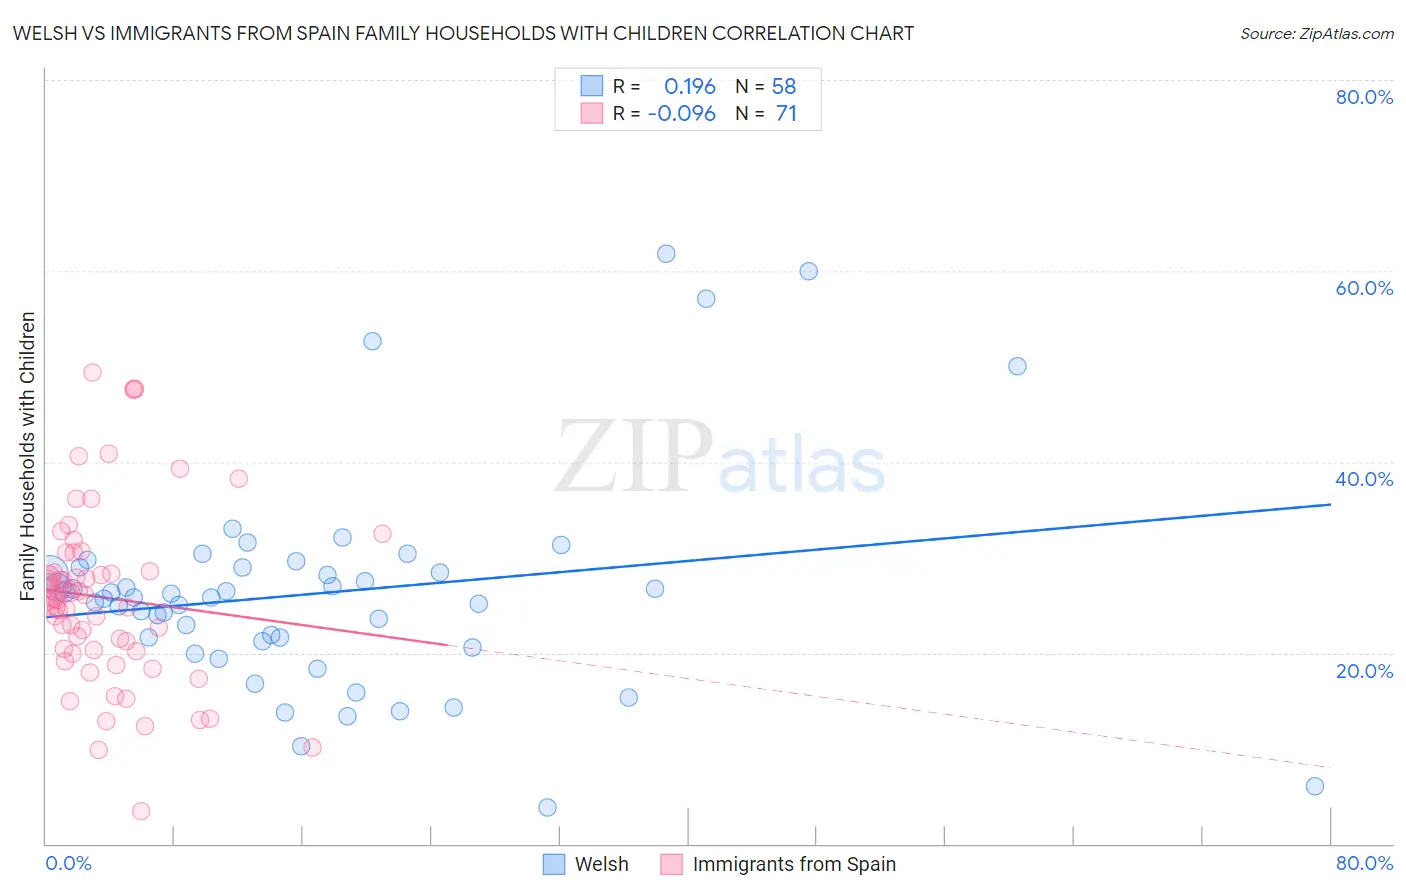
Welsh vs Immigrants from Spain Family Households with Children Correlation Chart
The statistical analysis conducted on geographies consisting of 527,895,960 people shows a poor positive correlation between the proportion of Welsh and percentage of family households with children in the United States with a correlation coefficient (R) of 0.196 and weighted average of 27.2%. Similarly, the statistical analysis conducted on geographies consisting of 239,534,267 people shows a slight negative correlation between the proportion of Immigrants from Spain and percentage of family households with children in the United States with a correlation coefficient (R) of -0.096 and weighted average of 26.6%, a difference of 2.0%.
Family Households with Children Correlation Summary
| Measurement | Welsh | Immigrants from Spain |
| Minimum | 3.8% | 3.4% |
| Maximum | 61.8% | 49.4% |
| Range | 58.0% | 46.0% |
| Mean | 26.3% | 25.8% |
| Median | 25.8% | 25.7% |
| Interquartile 25% (IQ1) | 21.2% | 20.3% |
| Interquartile 75% (IQ3) | 28.9% | 28.5% |
| Interquartile Range (IQR) | 7.7% | 8.2% |
| Standard Deviation (Sample) | 11.3% | 9.1% |
| Standard Deviation (Population) | 11.2% | 9.1% |
Similar Demographics by Family Households with Children
Demographics Similar to Welsh by Family Households with Children
In terms of family households with children, the demographic groups most similar to Welsh are Immigrants from Ukraine (27.2%, a difference of 0.010%), Immigrants from Dominica (27.2%, a difference of 0.010%), Okinawan (27.2%, a difference of 0.020%), African (27.2%, a difference of 0.060%), and Northern European (27.2%, a difference of 0.060%).
| Demographics | Rating | Rank | Family Households with Children |
| Immigrants | Sudan | 21.6 /100 | #204 | Fair 27.3% |
| Immigrants | Haiti | 20.3 /100 | #205 | Fair 27.2% |
| Immigrants | Micronesia | 20.2 /100 | #206 | Fair 27.2% |
| Haitians | 19.8 /100 | #207 | Poor 27.2% |
| Immigrants | Poland | 16.4 /100 | #208 | Poor 27.2% |
| Dutch West Indians | 15.8 /100 | #209 | Poor 27.2% |
| Immigrants | Ukraine | 14.4 /100 | #210 | Poor 27.2% |
| Welsh | 14.2 /100 | #211 | Poor 27.2% |
| Immigrants | Dominica | 13.9 /100 | #212 | Poor 27.2% |
| Okinawans | 13.7 /100 | #213 | Poor 27.2% |
| Africans | 13.0 /100 | #214 | Poor 27.2% |
| Northern Europeans | 12.8 /100 | #215 | Poor 27.2% |
| Cubans | 12.2 /100 | #216 | Poor 27.1% |
| U.S. Virgin Islanders | 12.1 /100 | #217 | Poor 27.1% |
| Greeks | 11.4 /100 | #218 | Poor 27.1% |
Demographics Similar to Immigrants from Spain by Family Households with Children
In terms of family households with children, the demographic groups most similar to Immigrants from Spain are Immigrants from Northern Europe (26.7%, a difference of 0.030%), Celtic (26.6%, a difference of 0.080%), Eastern European (26.7%, a difference of 0.11%), Immigrants from Hungary (26.7%, a difference of 0.12%), and Immigrants from Europe (26.6%, a difference of 0.14%).
| Demographics | Rating | Rank | Family Households with Children |
| Immigrants | Denmark | 0.8 /100 | #269 | Tragic 26.7% |
| Immigrants | Zaire | 0.7 /100 | #270 | Tragic 26.7% |
| French | 0.7 /100 | #271 | Tragic 26.7% |
| Somalis | 0.7 /100 | #272 | Tragic 26.7% |
| Immigrants | Hungary | 0.6 /100 | #273 | Tragic 26.7% |
| Eastern Europeans | 0.6 /100 | #274 | Tragic 26.7% |
| Immigrants | Northern Europe | 0.5 /100 | #275 | Tragic 26.7% |
| Immigrants | Spain | 0.5 /100 | #276 | Tragic 26.6% |
| Celtics | 0.4 /100 | #277 | Tragic 26.6% |
| Immigrants | Europe | 0.4 /100 | #278 | Tragic 26.6% |
| Finns | 0.4 /100 | #279 | Tragic 26.6% |
| Senegalese | 0.4 /100 | #280 | Tragic 26.6% |
| Lithuanians | 0.3 /100 | #281 | Tragic 26.6% |
| French American Indians | 0.3 /100 | #282 | Tragic 26.6% |
| Immigrants | North America | 0.3 /100 | #283 | Tragic 26.6% |